We have enjoyed providing you with the COVID-19 wastewater results over the past two years - thank you for your support!
Moving forward, Saskatchewan Health Authority will take over reporting COVID-19 wastewater results. You can access the data here.
University of Saskatchewan (USask) and Global Water Futures researchers are using wastewater-based epidemiology to monitor for SARS-CoV-2 (the virus causing COVID-19) in Saskatoon, Prince Albert, and North Battleford wastewater, providing early warning of infection outbreaks. This work is being done in partnership with the Saskatchewan Health Authority, Public Health Agency of Canada, City of Saskatoon, City of Prince Albert and City of North Battleford.
Most people with COVID-19 start shedding SARS-CoV-2 within 24 hours of being infected through their feces. This “viral signal” detected in wastewater helps provide population-level estimates of the rate of infection in a city, indicating whether the number of infected people is increasing, decreasing or staying the same. This signal is a leading indicator of impending surges in number of active cases by 7 to 10 days following sample collection. To learn more, please see below.
Understanding the data
- The following provides the most recent data for:
- City of Saskatoon (August 26, 2020 to June 28, 2023)
- City of North Battleford (August 21, 2021 to June 23, 2023)
- City of Prince Albert (August 24, 2021 to June 19, 2023)
- When interpreting these data, increases in the viral signal in the wastewater are roughly indicative of increases in new positive cases in the following 7-10 days, and decreases are roughly indicative of anticipated decreases in new positive cases.
- It is important to note that the magnitudes of these changes are not always proportional, i.e., a four-fold increase in the viral signal does not always correspond to a four-fold increase in case numbers; it should rather be seen as a gauge for the direction of change.
- Overall viral loads and variant-specific viral loads are determined using separate sets of tests with different sensitivities. Thus, viral loads should not be directly compared.
- This variant tracking data should be seen merely as an indicator of trends that need to be verified using sequencing technology through the Public Health Agency of Canada.
- It is also important to note that results from the three cities are not directly comparable due to differences in sampled wastewater, wastewater management workflows and analytical methods.
- Please note that the COVID-19 case data is not reported here as the zones found on the Saskatchewan COVID dashboard do not match with the area where wastewater data is collected. The wastewater data is only representative of each city proper.
- While detecting trends through wastewater surveillance can help inform modelling of COVID-19 spread, residents should rely on provincial COVID-19 updates as their primary source of information and follow all provincial COVID-19 prevention health orders and guidelines.
Saskatoon Wastewater Data
Status and Trends through June 28, 2023:
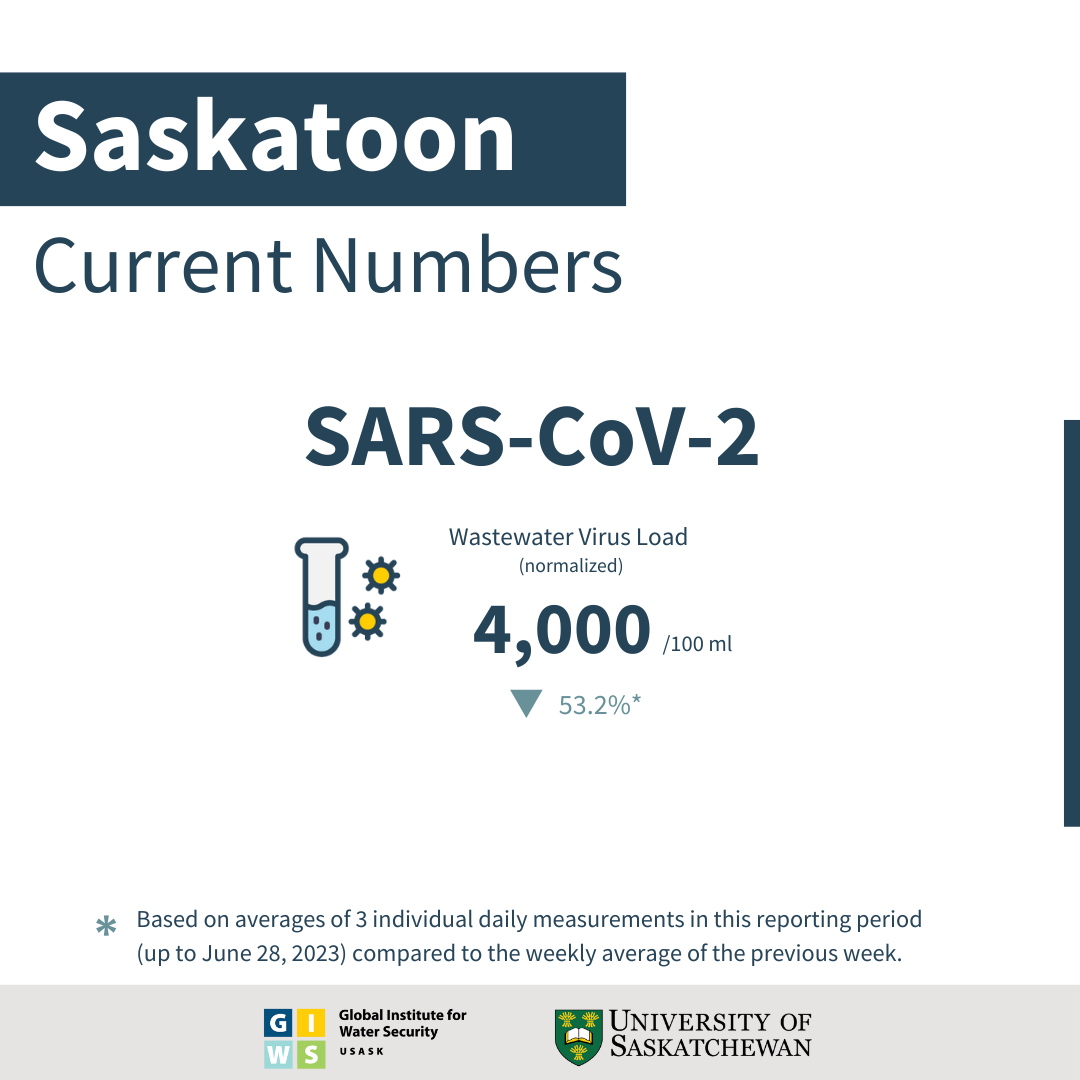
- SARS-CoV-2 viral RNA load in Saskatoon's wastewater has reduced by 53.2% (based on averages of 3 individual daily measurements) in this reporting period (up to June 28, 2023) compared to the weekly average of the previous weeks (∼ 8,000 gene copies / 100 mL).
- This week’s ∼4,000 gene copies / 100 mL viral load is the One hundred and nine highest viral load observed during the pandemic in Saskatoon.
- This concentration of viral particles is regarded as Low because it is below the range (<20,000 ≤ 100,000; ∆C <100%) considered as the Low level in Saskatoon.
- This level of the viral RNA load indicates that SARS-CoV-2 infection in Saskatoon needs continuous monitoring.
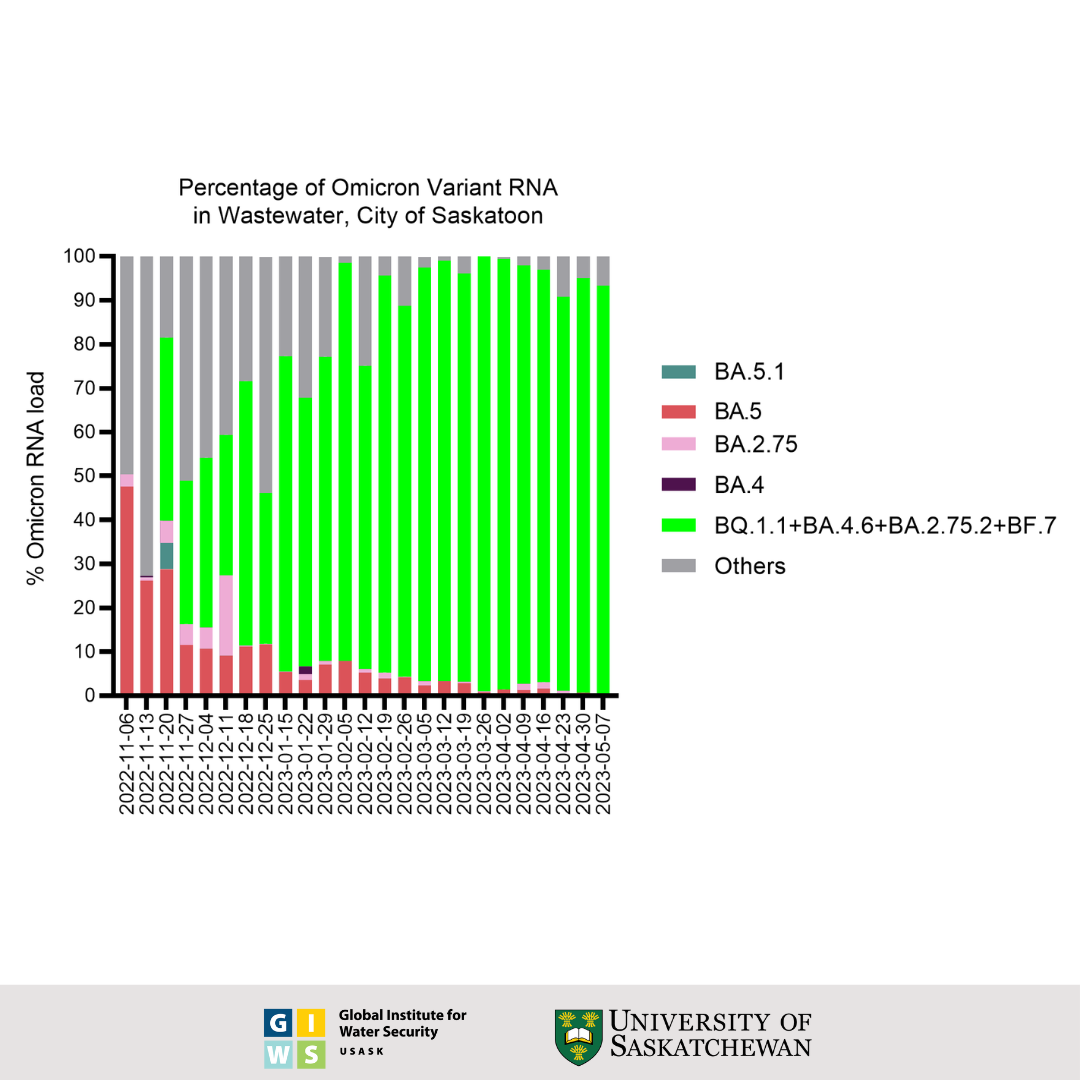
- Whole genome sequencing confirmed the presence of BF.7, BQ.1, BQ.1.1 and BQ.1.8 in earlier samples, which have S: R346T, S:K444T, S:N460K mutations associated with immune escape. In addition, the sequences of the most recently collected sample relative to the previously collected samples indicate the level of presence of BA.2 in Saskatoon's wastewater to be 90% stable.
- All data has been shared with Saskatchewan health authorities.
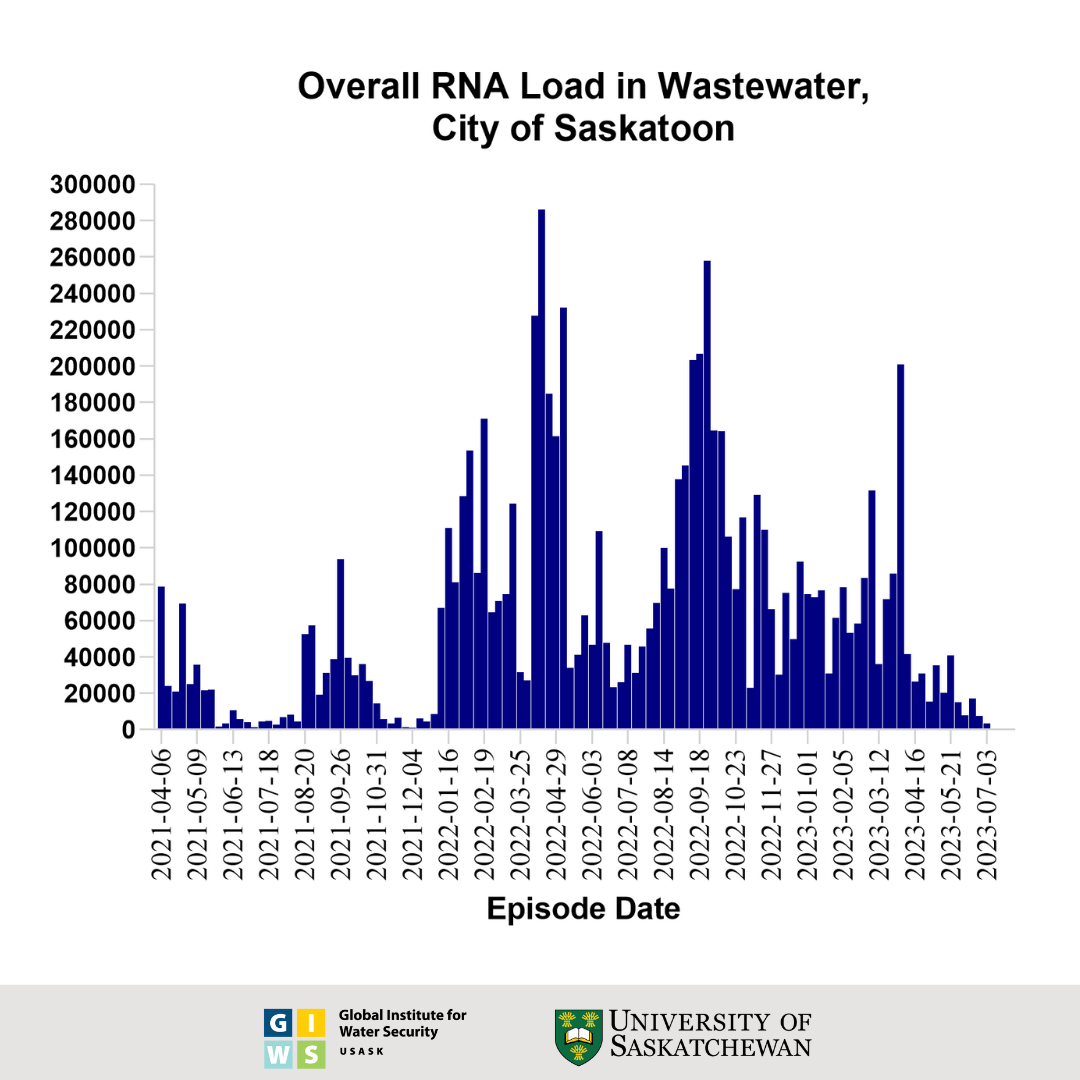
This graph shows the wastewater surveillance data for Saskatoon, SK, which is a normalized virus load per 100 millilitres of wastewater. The bars represent the average overall viral load of three individual samples taken over the course of each week. These results were generated using an RT-qPCR test for the viral nucleocapsid (N) gene and adjusted for the extraction efficiency of viral RNA.
North Battleford Wastewater Data
Status and Trends through June 23, 2023:
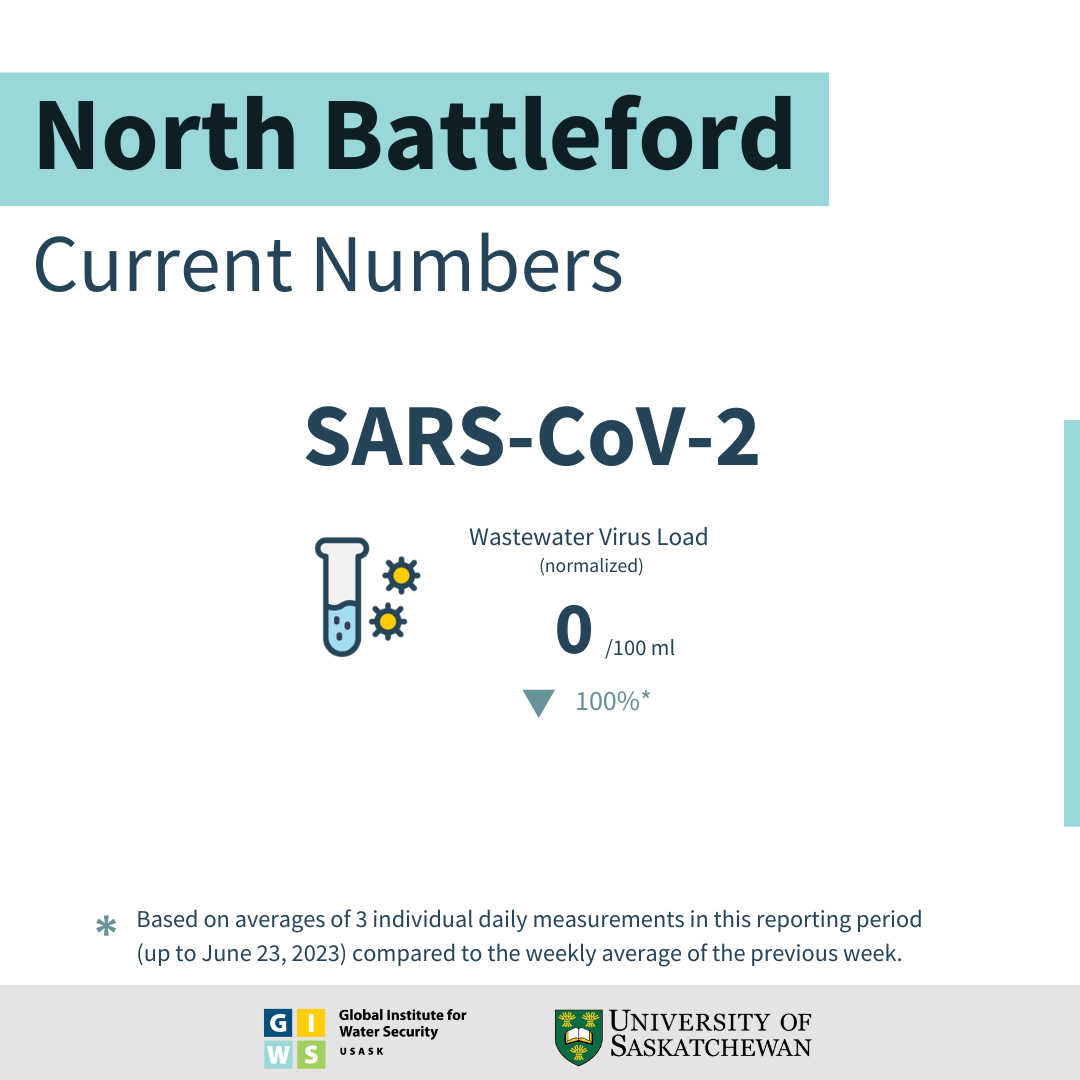
- SARS-CoV-2 viral RNA load in North Battleford's wastewater has reduced by 100% (based on averages of 3 individual daily measurements) in this reporting period (up to June 23, 2023) compared to the weekly average of the previous week (∼3000 gene copies / 100 mL).
- The viral load of ∼ 0 gene copies / 100 mL measured this week is considered Low because it is below the range (<20,000 ≤ 100,000; ∆C <100%) regarded as the Low level in North Battleford.
- This concentration is the Ninety-six highest value observed during the pandemic in North Battleford.
- This week's viral RNA load indicates that the SARS-CoV-2 infection in North Battleford’s are reducing.
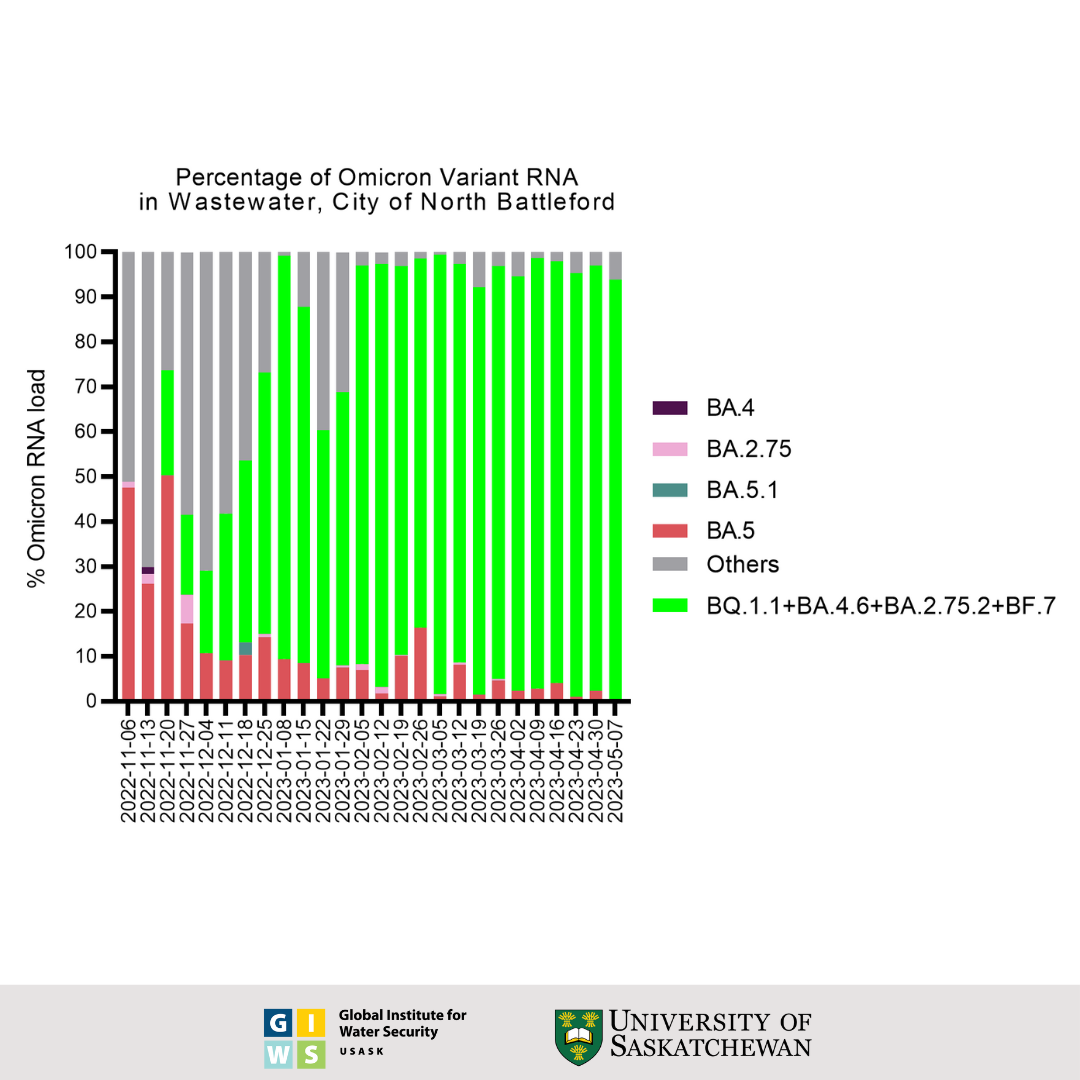
- Whole genome sequencing confirmed the presence of BE.1.1 in earlier samples. Whole genome sequencing confirmed the presence of BE.1.1, BW.1.1, BA.5.10.1, DF.1.1, XBB.1.5, BQ.1.1.3, and BQ.1.1.4 in earlier samples, which have S: Y144del, S: R346T, S:K444T, S: N460K, S: F486P, S:F490S mutations associated with immune escape. In addition, the sequences of the most recently collected sample relative to the previously collected samples indicate the level of presence of BA.2 and BA.5 in North Battleford's wastewater to be 89% increasing and 43% decreasing respectively.
- All data has been shared with Saskatchewan health authorities.
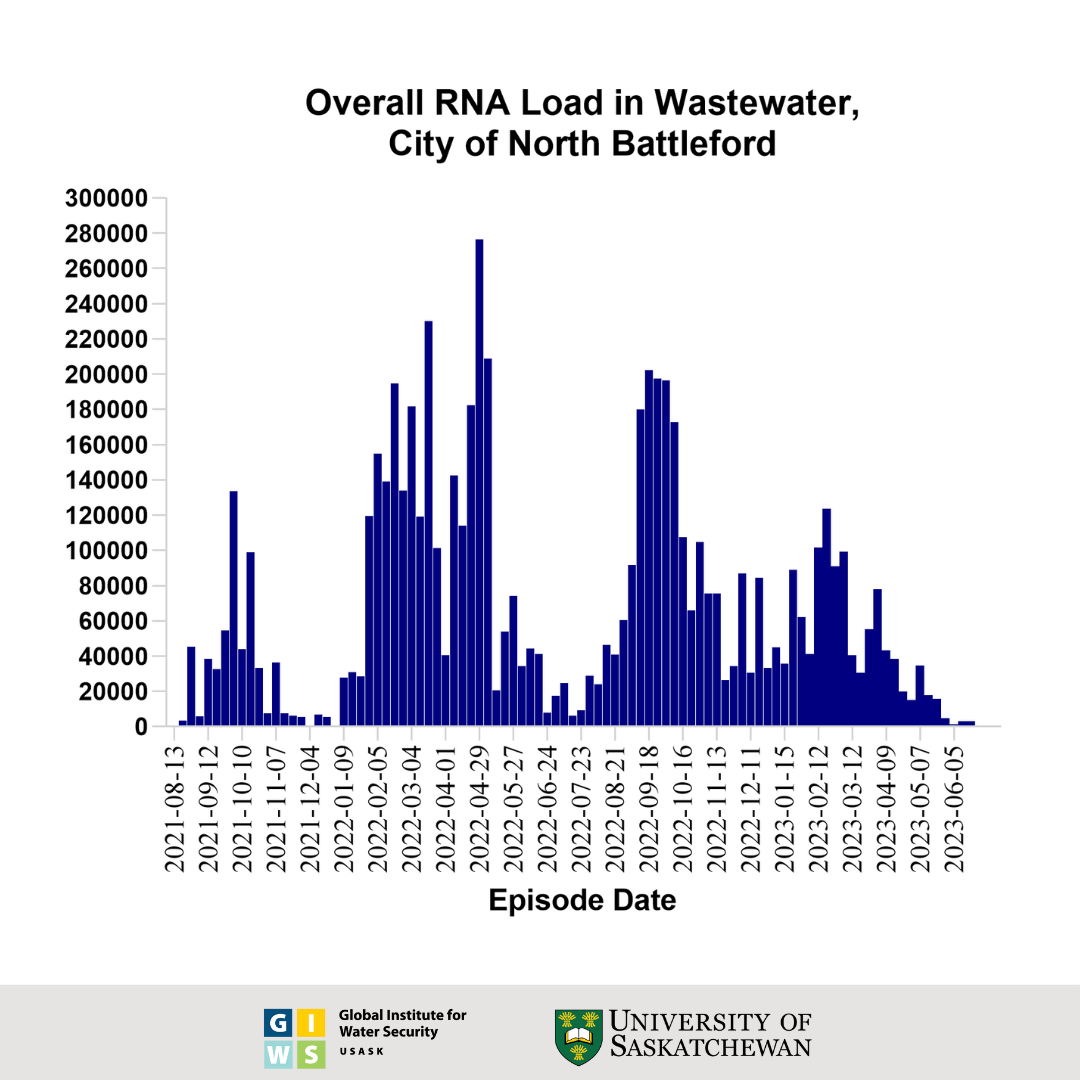
This graph shows the wastewater surveillance data for North Battleford, SK, which is a normalized virus load per 100 millilitres of wastewater. The bars represent the average overall viral load of three individual samples taken over the course of each week. These results were generated using an RT-qPCR test for the viral nucleocapsid (N) gene and adjusted for the extraction efficiency of viral RNA.
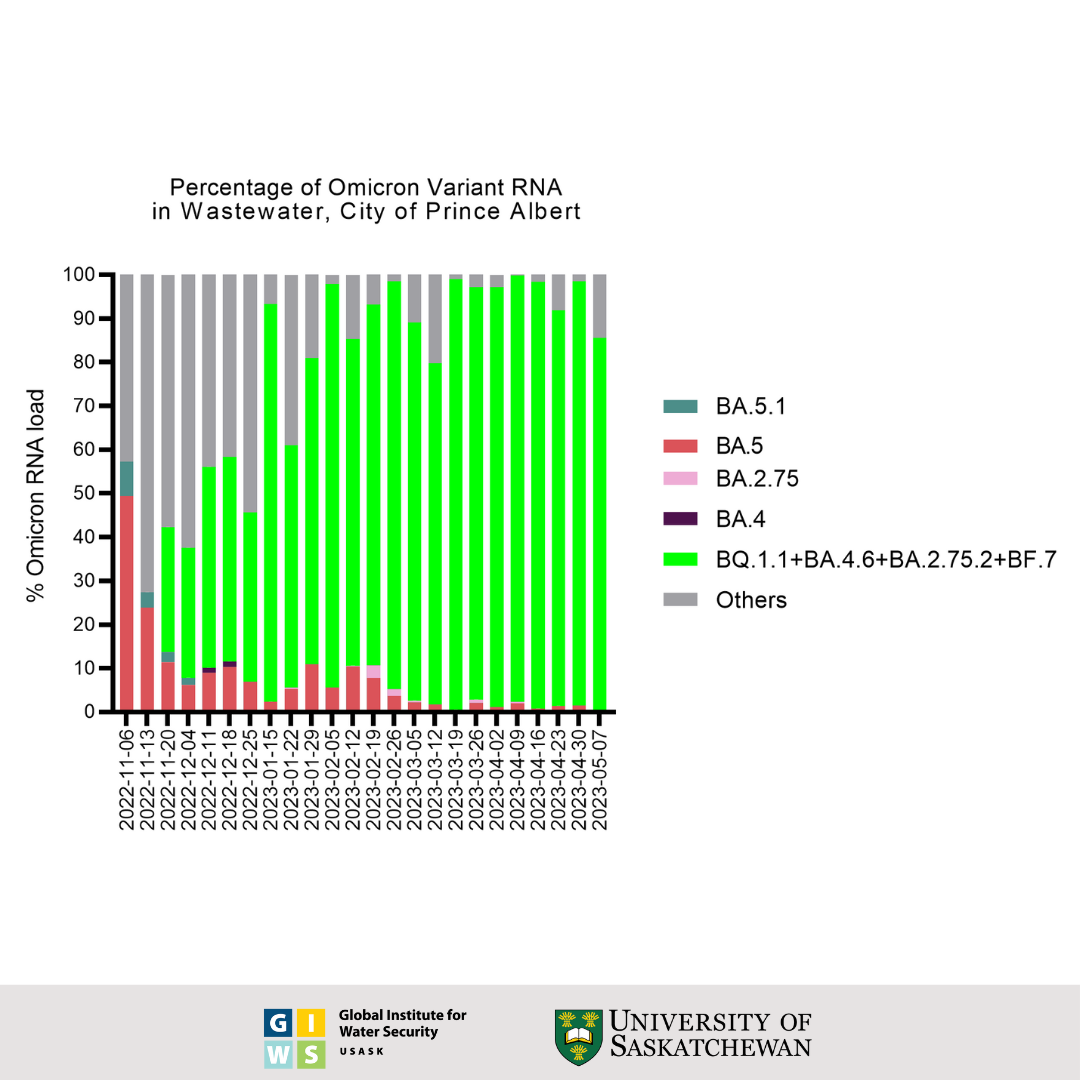
Prince Albert Wastewater Data
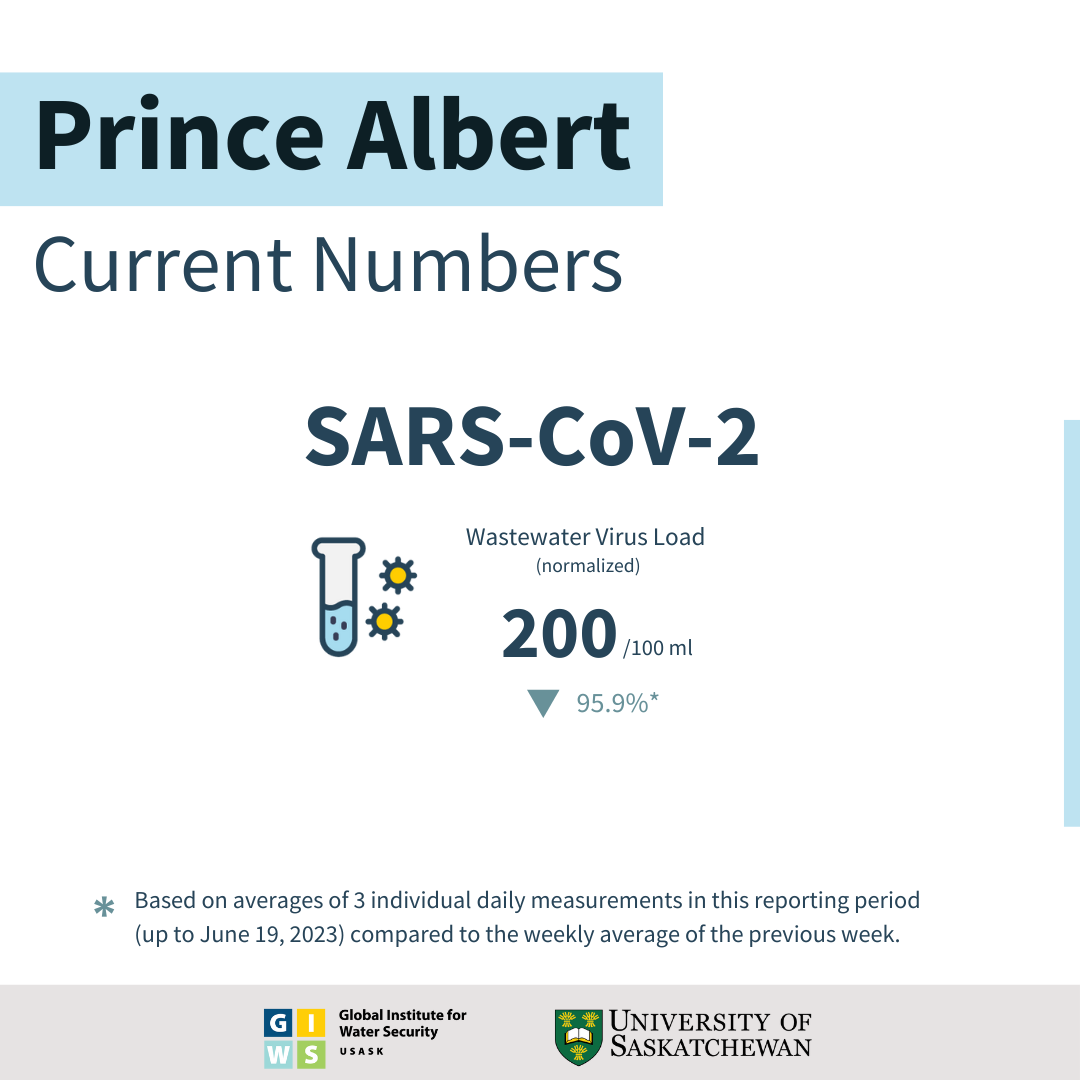
Status and Trends through June 19, 2023:
- SARS-CoV-2 viral RNA load in Prince Albert's wastewater has reduced by 95.9% (based on averages of 3 individual daily measurements) in this reporting period (up to June 19, 2023) compared to the weekly average of the previous weeks (∼4000 gene copies / 100 mL).
- The viral load of ∼ 200 gene copies / 100 mL measured this week is the One hundred and one highest value observed during the pandemic in Prince Albert.
- This concentration of viral particles is considered Low because it is below the range (<50,000; ∆C < 100%) and regarded as Low in Prince Albert.
- This week's viral RNA load indicates that the SARS-CoV-2 infections in Prince Albert are reducing.
- Whole genome sequencing confirmed the presence of BQ.1, BQ.1.1, BQ.1.1.4, BQ.1.18, XBB.1.5, BA.5.2.1 and BE.1.1 in earlier samples, S: Y144del, S: R346T, S: K444T, S: N460K mutations associated with immune escape. In addition, the sequences of the most recently collected sample relative to the previously collected samples indicate the level of presence of BA.2 in Prince Albert's wastewater to be 94% stable.
- All data has been shared with Saskatchewan health authorities.
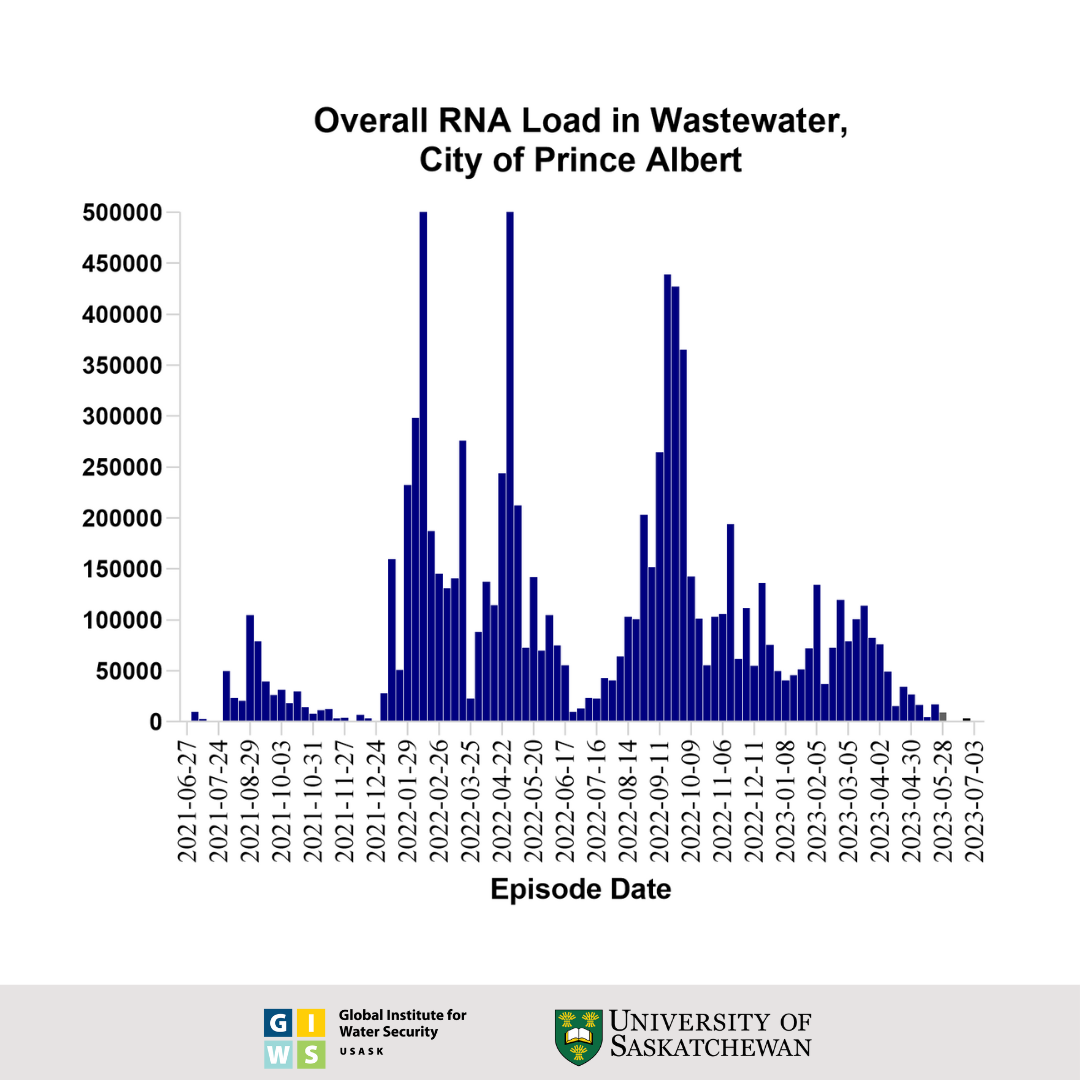
This graph shows the wastewater surveillance data for Prince Albert, SK, which is a normalized virus load per 100 millilitres of wastewater. The bars represent the average overall viral load of three individual samples taken over the course of each week. These results were generated using an RT-qPCR test for the viral nucleocapsid (N) gene and adjusted for the extraction efficiency of viral RNA.
Measuring Virus Indicators in Wastewater as an Early Warning of COVID-19 Outbreaks
Most people with COVID-19 start shedding SARS-CoV-2 through their stool within 24 hours of being infected. This “viral signal” detected in wastewater helps provide population-level estimates of the rate of infection in a municipality, indicating whether the number of infected people in a city is increasing, decreasing or staying the same. Even a few days of early warning in communities can be critical to the success of pandemic preparedness measures, especially for rapidly evolving variants.
The viral wastewater signal is a leading indicator of impending surges in numbers of active cases that precede increases in new positive cases by seven to 10 days. By gathering this information which in effect surveys all of the individuals connected to the wastewater collection system, the team and its partners are able to warn of upcoming increases in positive cases (see news releases below).
This information on the level of the coronavirus genetic material (known as RNA) complements testing performed on individuals (swab testing) that is the centerpiece of COVID-19 surveillance strategies globally.
Swab tests are limited by the fact that COVID-19 symptoms might not appear for as many as five days after infection. These tests do not capture cases of people who are already infected but do not yet show symptoms (pre-symptomatic), or those who show no symptoms at all (asymptomatic), or only very mild ones (oligosymptomatic). As well, not everyone with COVID-19 is tested, and obtaining results can take time.
The research team is also screening for the top three variants of concern: Alpha (B.1.1.7), Gamma (P.1) and Delta (B.1.617). Additional variants will be added to the panel as the situation evolves.
This variant tracking data should be seen merely as an indicator of trends which need to be verified using sequencing technology through the Public Health Agency of Canada. Because individuals are at varying stages of infection when shedding the virus, the variant levels detected in sewage are not necessarily directly comparable to the proportion of variant cases found in individual swab samples confirmed through provincial genetic sequencing efforts.
USask is now designated as the Prairie Node of PHACs Canada-wide WBE efforts and has expanded to testing wastewater from three cities (Saskatoon, Prince Albert, North Battleford) and other communities in Saskatchewan, including five First Nations in collaboration with the Indigenous Technical Services Cooperative. The team has also successfully participated in an interlab comparison study coordinated by the Canadian Water Network.
Some guidelines for interpreting wastewater data are available from US CDC here.
Researchers and Funding
Researchers
USask researchers Prof. John P. Giesy (Toxicology Centre and Western College of Veterinary Medicine), Kerry McPhedran (College of Engineering), and Markus Brinkmann (School of Environment and Sustainability, Global Institute for Water Security, and Toxicology Centre), in partnership with the City of Saskatoon and the Saskatchewan Health Authority, have turned to wastewater-based epidemiology (WBE) to monitor Saskatoon's wastewater for SARS-CoV-2, the virus causing COVID-19. The team also includes toxicologist Paul Jones, program manager Dr. Yuwei Xie, engineering PhD student Mohsen Asadi, and Toxicology Centre research associates Dr. Femi Oloye and Jenna Cantin.
Funding
This research has initially been funded through the Global Water Futures (GWF) program and has received dedicated funding support from the Public Health Agency of Canada in February. The team has successfully participated in an interlab comparison study coordinated by the Canadian Water Network. The team is grateful for the continued in-kind support through the City of Saskatoon, the City of Prince Albert, and the City of North Battleford - particularly staff at the wastewater treatment plants who provide wastewater samples.

Media
Related USask News Releases

USask partners with Indigenous communities and City of Saskatoon on COVID-19 wastewater study funded by the Public Health Agency of Canada
(USask Research Profile and Impact, Feb 22, 2021)

Imminent surge in new COVID-19 cases in Saskatoon: USask wastewater data
(USask Research Profile and Impact, November 19, 2020)

COVID-19 levels in Saskatoon’s wastewater point to upcoming increase in cases
(USask Research Profile and Impact, October 30, 2020)
Media Inquiries
For more information, contact:
Victoria Dinh , USask Media Relations
306-966-5487
victoria.dinh@usask.ca
Frequently Asked Questions
First, each point on the graph represents one sample taken in the study. When reporting viral load data, the percent change reported compares the average of the 3 individual samples taken during the week, to the average of the 3 samples from the week before. Therefore, when looking at week-over-week changes in the graphs, one should compare the 3 most recent points on the graph, to the 3 points before.
With increasing vaccination rates, we are expecting to see a decrease in new cases going forward (as is already observed in older age groups that have been vaccinated first). That decrease in newly infected people is then also expected to result in a reduction in viral traces in the wastewater. For the time being, however, while Saskatchewan has one of the lowest rates of fully vaccinated residents in Canada (around 58% fully vaccinated, as of August 25), epidemiologists estimate that a vaccination rate upwards of 75% is required to achieve herd immunity. Thus, we do not expect to see the impact of vaccinations in wastewater just yet.
In the best case, a vaccinated person would be protected and not get infected with the virus in the first place, thereby preventing any shedding altogether. With the arrival of the variants of concern (VOCs) in Saskatchewan, epidemiologists see an increasing number of breakthrough infections in vaccinated individuals. These are often asymptomatic or have relatively mild symptoms but can nonetheless shed the virus and be infectious.
The mRNA vaccines (Moderna, Pfizer-BioNTech) are based on sequences of the S gene (i.e., the spike protein that allows the virus to enter host cells). The viral RNA signal we are tracking in the wastewater is for the N gene (i.e., the nucleocapsid shell of the virus). These are two entirely different sequences without cross-reactivity. The N gene is also widely used in very similar clinical diagnostic tests for the coronavirus that are performed on individual swab samples. These tests – like the one we use for wastewater – will not identify a patient who was recently vaccinated with one of the mRNA vaccines as positive for the coronavirus. Please note that this can be different for rapid testing kits that are based on antibodies.
Depending on stage of infection, individuals infected with SARS-CoV-2 may shed greater or lesser amounts of the virus through their feces. During the exponential phase of an outbreak, many individuals are in a similar stage of infection, and increases in the viral signal in wastewater are often directly proportional to new case numbers, as was observed in October and November 2020 in Saskatoon. Under different conditions, individuals are typically in various stages of infection and recovery, and the proportionality decreases.
We provide weekly reports to the City of Saskatoon, the Saskatchewan Health Authority, and as well as the Public Health Agency of Canada.
Data from other jurisdictions show that fluctuations in the wastewater collection and treatment system, e.g., influx of water and road salts during snowmelt, can have a considerable impact on the viral signal in wastewater. In Saskatoon, domestic sewers and storm sewers are separate, and average daily flows, water temperatures, dissolved and particulate matter, as well as pH, are remarkably stable throughout the year. All of these factors contribute to the exceptionally high predictive value of wastewater-based surveillance in Saskatoon.
It has been proposed that individual stool samples could be used to test whether a patient tests positive for SARS-CoV-2. However, some studies indicate that not all patients will consistently shed the virus through their feces. Thus, nasopharyngeal swab testing is still considered the gold standard for individual patient testing. Thus, while wastewater data shows the trend of overall infected cases at the municipal level, it is not a diagnosis tool for individuals. Anyone who thinks he or she might have COVID or who has been exposed to someone with COVID should follow Saskatchewan Health Authority instructions and get a swab test.
As we announced at the end of November 2021, the protocol used for Saskatoon was changed to be more in line with the one being used for the other two cities in the study:
“Please note: The wastewater surveillance team has used a test protocol based on the supernatant fraction of primary influent for their surveillance efforts in Saskatoon. Due to the higher throughput, samples from all other monitored locations in Saskatchewan were processed using a whole raw influent protocol. We have collected data for the Saskatoon WWTP using both methods since May 2021, and the methods provide essentially the same trends. Furthermore, the whole raw influent protocol offers slightly greater sensitivity. Therefore, beginning with the next report, the team will begin generating and reporting data and trends using the whole raw influent protocol only.”
As the announcement states, much data was collected using both methods, and both methods showed essentially the same trends. Since it is the rate of change which is key to interpreting this data, the absolute viral load numbers are not directly meaningful, which is why we were able to make the switch relatively seamlessly.
Overall viral loads and variant-specific viral loads are determined using separate sets of tests with different sensitivities. Thus, viral loads should not be directly compared.