This chapter presents the impacts of sectors and associated industries on freshwater systems and the related ecological, economic, and social issues. Key sectors and industries with the most severe and systemic impacts on water resources were identified through a systematic and comprehensive literature review and expert evaluation. As shown in Figure 3, the industries having “very high” impacts fall under six economic sectors of the GICS taxonomy [15]: Consumer Staples, Consumer Discretionary, Energy, Health Care, Materials, and Utilities. Information Technology was also included as a key industry due to its identified emerging impacts throughout the value chain. (Other GICS industries identified in the literature review are discussed in Appendix E.)
Figure 3. Key sectors and industries within those sectors with the most severe and systemic impacts on freshwater resources.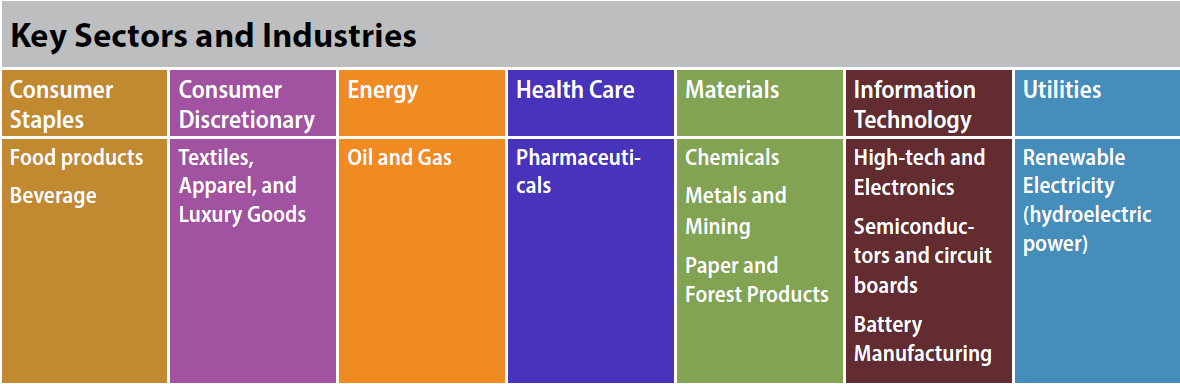
Using the DPSIR model (as explained in Chapter 1), all applicable data and information found in the literature on industry activities, its impacts on freshwater resources, and key geographical hotspots were organized following the value chains of each identified industry group. The water intensity and risk metrics used for the synthesis are drawn from trusted, independent sources, including peer-reviewed academic publications and literature.
This comprehensive modeling exercise to determine the degree of impact and industry specific impacts is novel and complementary to other tools, such as the CDP Water Impact Index and the SASB Materiality Map, which provide information on industrial sectors and companies and their water sustainability practices. This scientific assessment seeks to advance existing work on assessing water impacts created by industry in the following ways:
- Provides a comprehensive scoring and weightage of industry specific water impacts, based on DPSIR conceptual modeling and an extensive literature review starting from 1950 onwards.
- Factors in geographical context, based on evidence from scientific papers and grey literature, suggesting hotspots globally for freshwater impacts from industry practices.
- Provides insights on industry impacts from activities mapped across the value chain.
- Analyzes industry impacts on water quality and quantity.
Industrial Impacts on Freshwater: Assessment Criteria
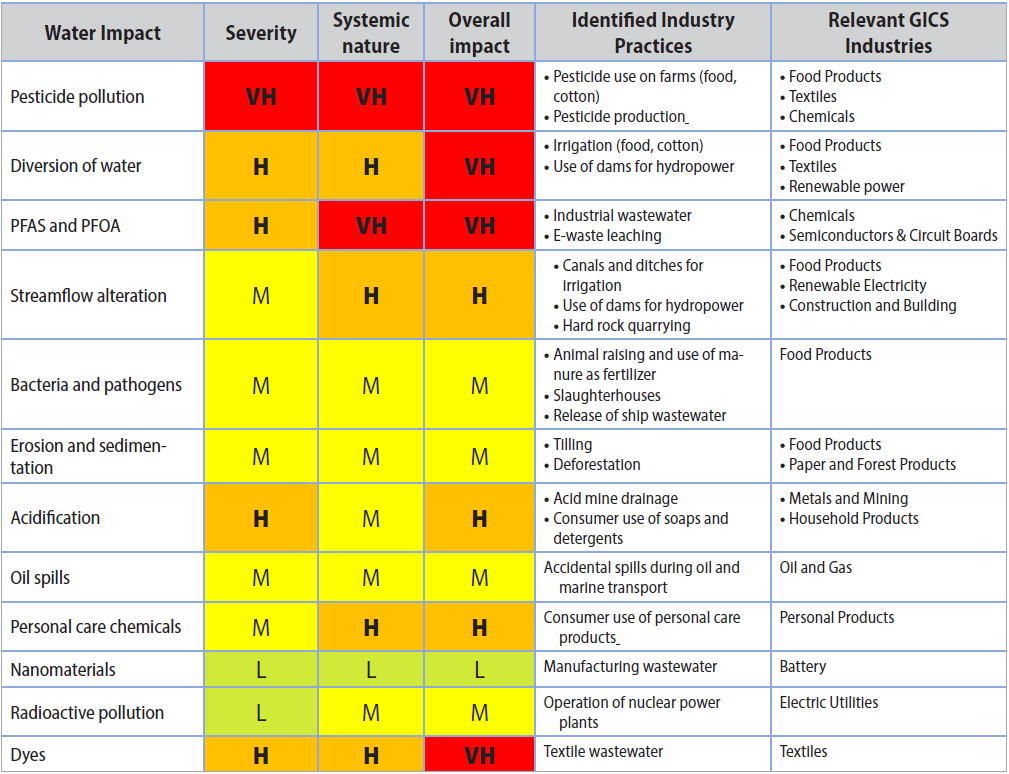
The key industries and practices that were identified as having the most damaging impacts on freshwater systems are included in Table 1. Industry impacts were evaluated based on severity (damages being caused to water resources) and the systemic nature of those impacts (the extent to which damages are affecting accessibility of other water users regionally and are costly for restoration). Impacts evaluated include water scarcity, such as surface and groundwater depletion, water diversion, and water quality due to a variety of pollutants. An overall designation of “very high” (“VH”) severity indicates that the impact is at an unacceptable level and causes catastrophic and irreversible damage to freshwater. “Very high” impacts are systemic in nature and significantly affect access to clean freshwater supplies across a variety of regions.
Table 1. Relative assessment of industrial impacts on freshwater. The table depicts the qualitative matrix used to evaluate the industrial impacts on freshwater resources at different stages of the value chain based on literature review and expert assessments. The matrix was developed based on a risk assessment methodology outlined in [16] and [17], and full methodology are included in Appendix D.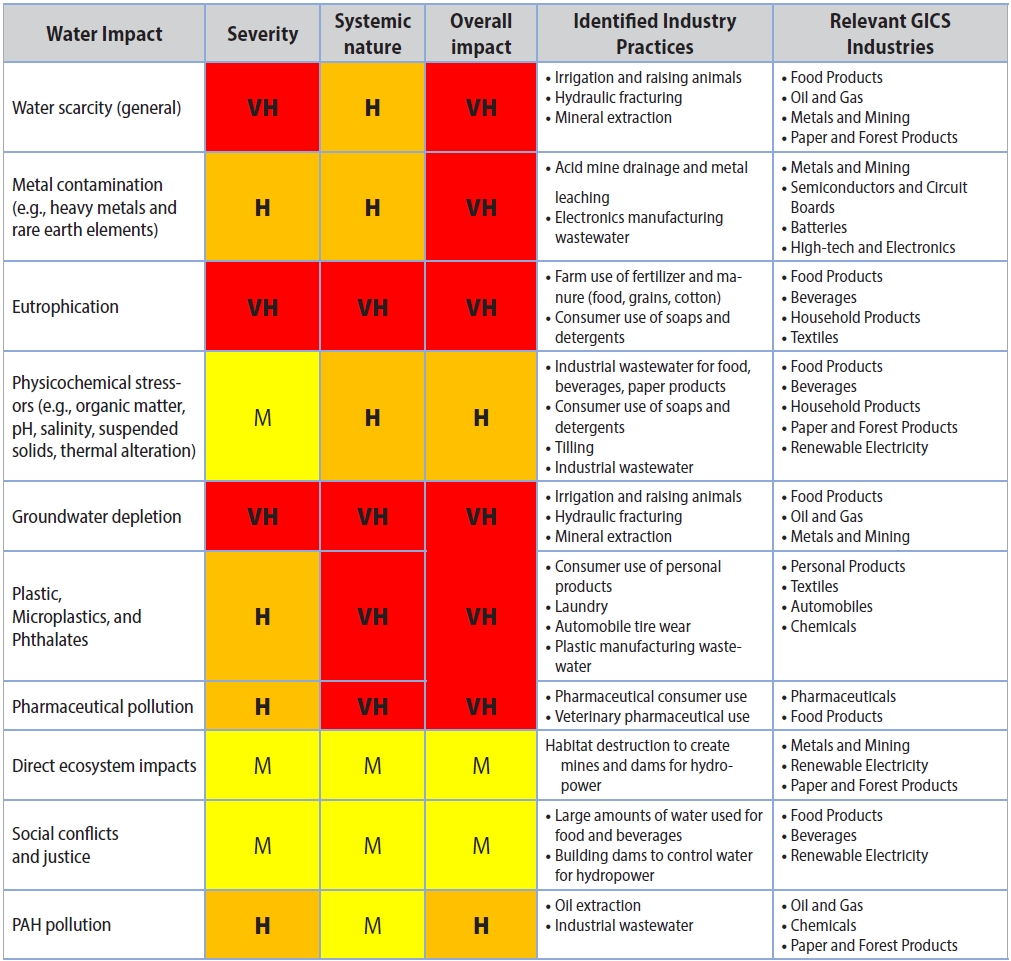
Exploring the key industries further, Table 2 provides a relative assessment of water impacts by industries within areas of the value chain, whether from direct operations, global supply chains, or end-product use. Industries with the most severe (“very high”) impacts throughout the value chain includes Food Products, Beverages, Textiles, Apparel, and Luxury Goods, Oil and Gas, Pharmaceuticals, Chemicals, Metals and Mining, Paper and Forest Products, and Renewable Electricity.
Table 2. Overall relative assessment of water quantity and water quality impacts across the value chains.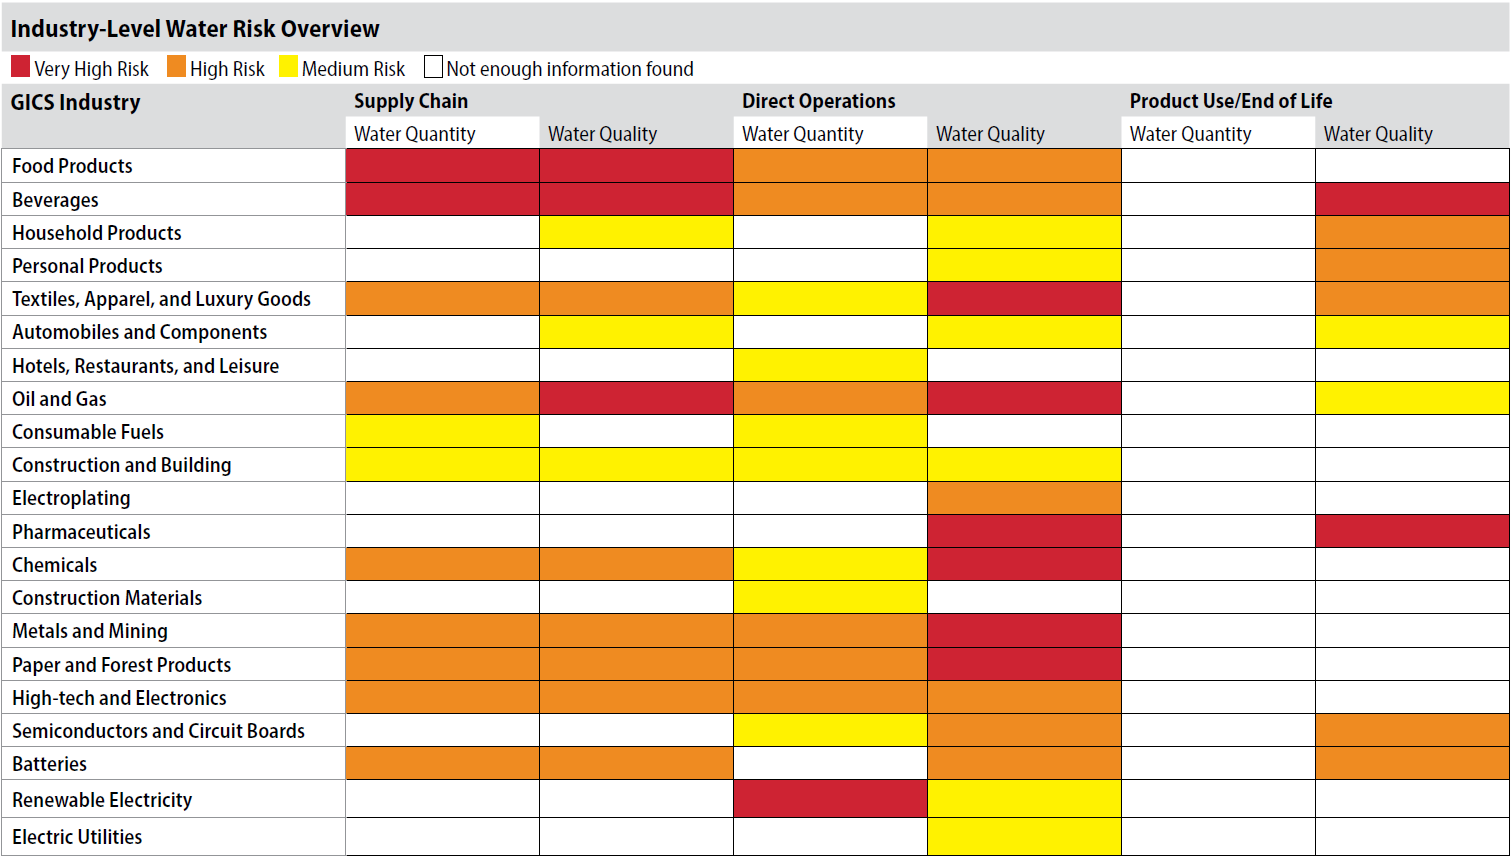
Industrial Sectors: Value Chain Analysis of Practices, Externalities, and Water Impacts Globally
The following sections provide further detail from the literature review and expert assessment of the different industries and practices that are contributing to “very high” impacts on water resources and key emerging industries as identified in the assessment as reflected in Tables 1 and 2. (Other GICS industries identified in the literature review are discussed in Appendix E.)
For each industry within the sector, a schematic is provided to depict the practices along the value chain and their associated externalities and water quantity and quality impacts. Each section also includes the associated geographies where impacts were observed that were frequently cited in the literature.
Figure 4. Summary of Food Products industry freshwater impacts along the value chain, including on-farm and off-farm. Selected hotpots are the regions frequently cited in the literature.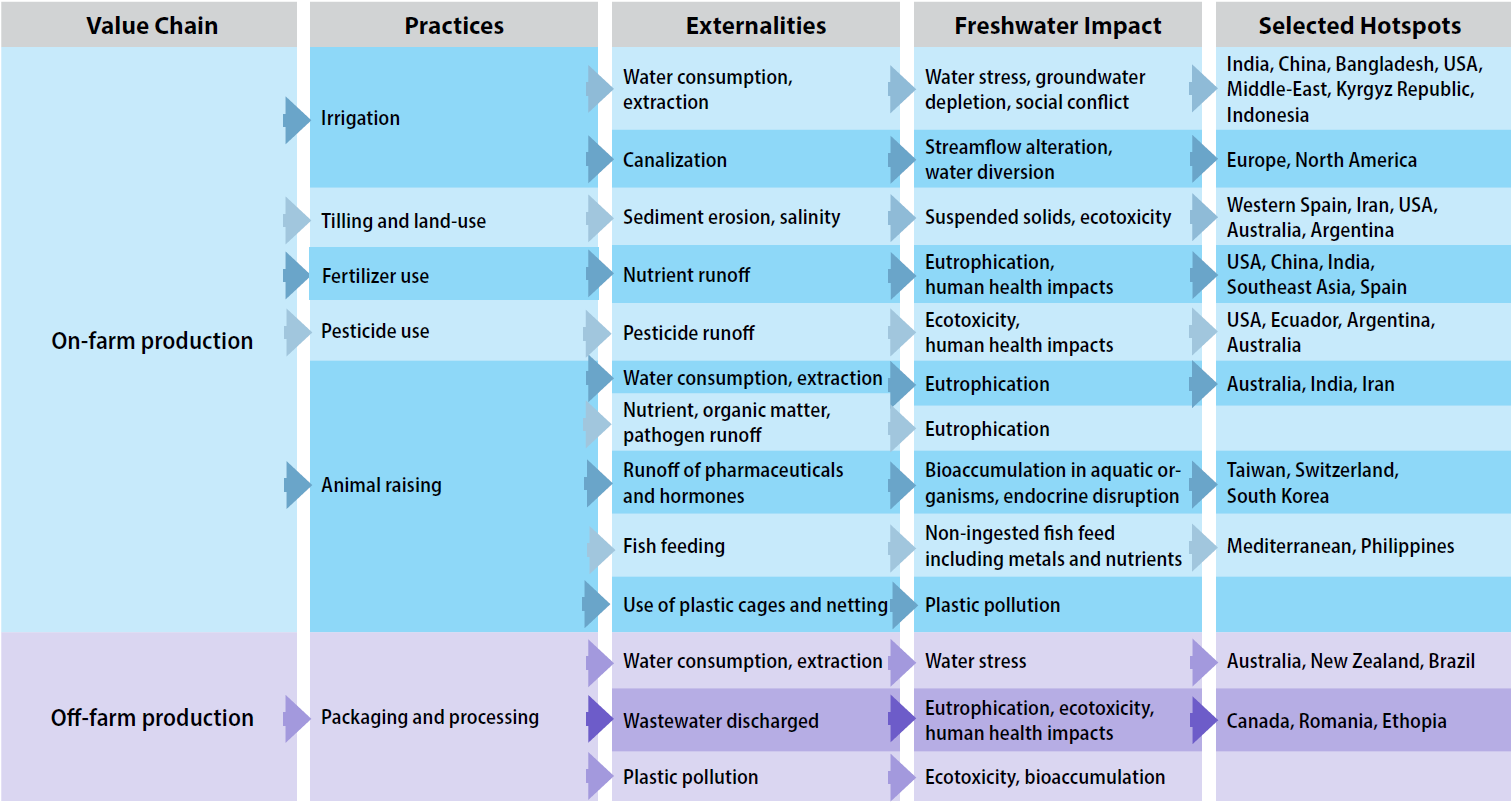
1. Consumer Staples Sector
The Consumer Staples sector includes industries that produce products that are essential for consumers, whether for food or day-today living. The key industries within the sector identified as causing significant impacts to freshwater resources include Food Products, Beverages, Household Products, and Personal Products. Food Products and Beverages were identified as having the most severe and systemic impacts. Others are included in Appendix E.
Food Products
The Food Products industry is the largest driver by far of water consumption, water pollution, and other water-related impacts globally. The industry, which includes growing crops, raising livestock and food for livestock, and processing ingredients for packaged foods, uses large amounts of the world’s freshwater [18], [19]. It is also a major contributor of point and nonpoint sources of water pollution (including nutrients, suspended solids, pesticides, herbicides, plastics, organic matter, pathogens, pharmaceuticals, and hormones). Agriculture is the leading driver of water degradation globally, and industries that rely extensively on agricultural supply chains are at higher risk than others.
Practices and associated externalities
Figure 5. The water footprint of selected crop and animal products: (a) water footprint in a liter of water per kilogram of product (L/kg), (b) water footprint in a liter of water per kilocalorie (L/kcal) of nutritional energy contained in the product. Data source [20]–[22].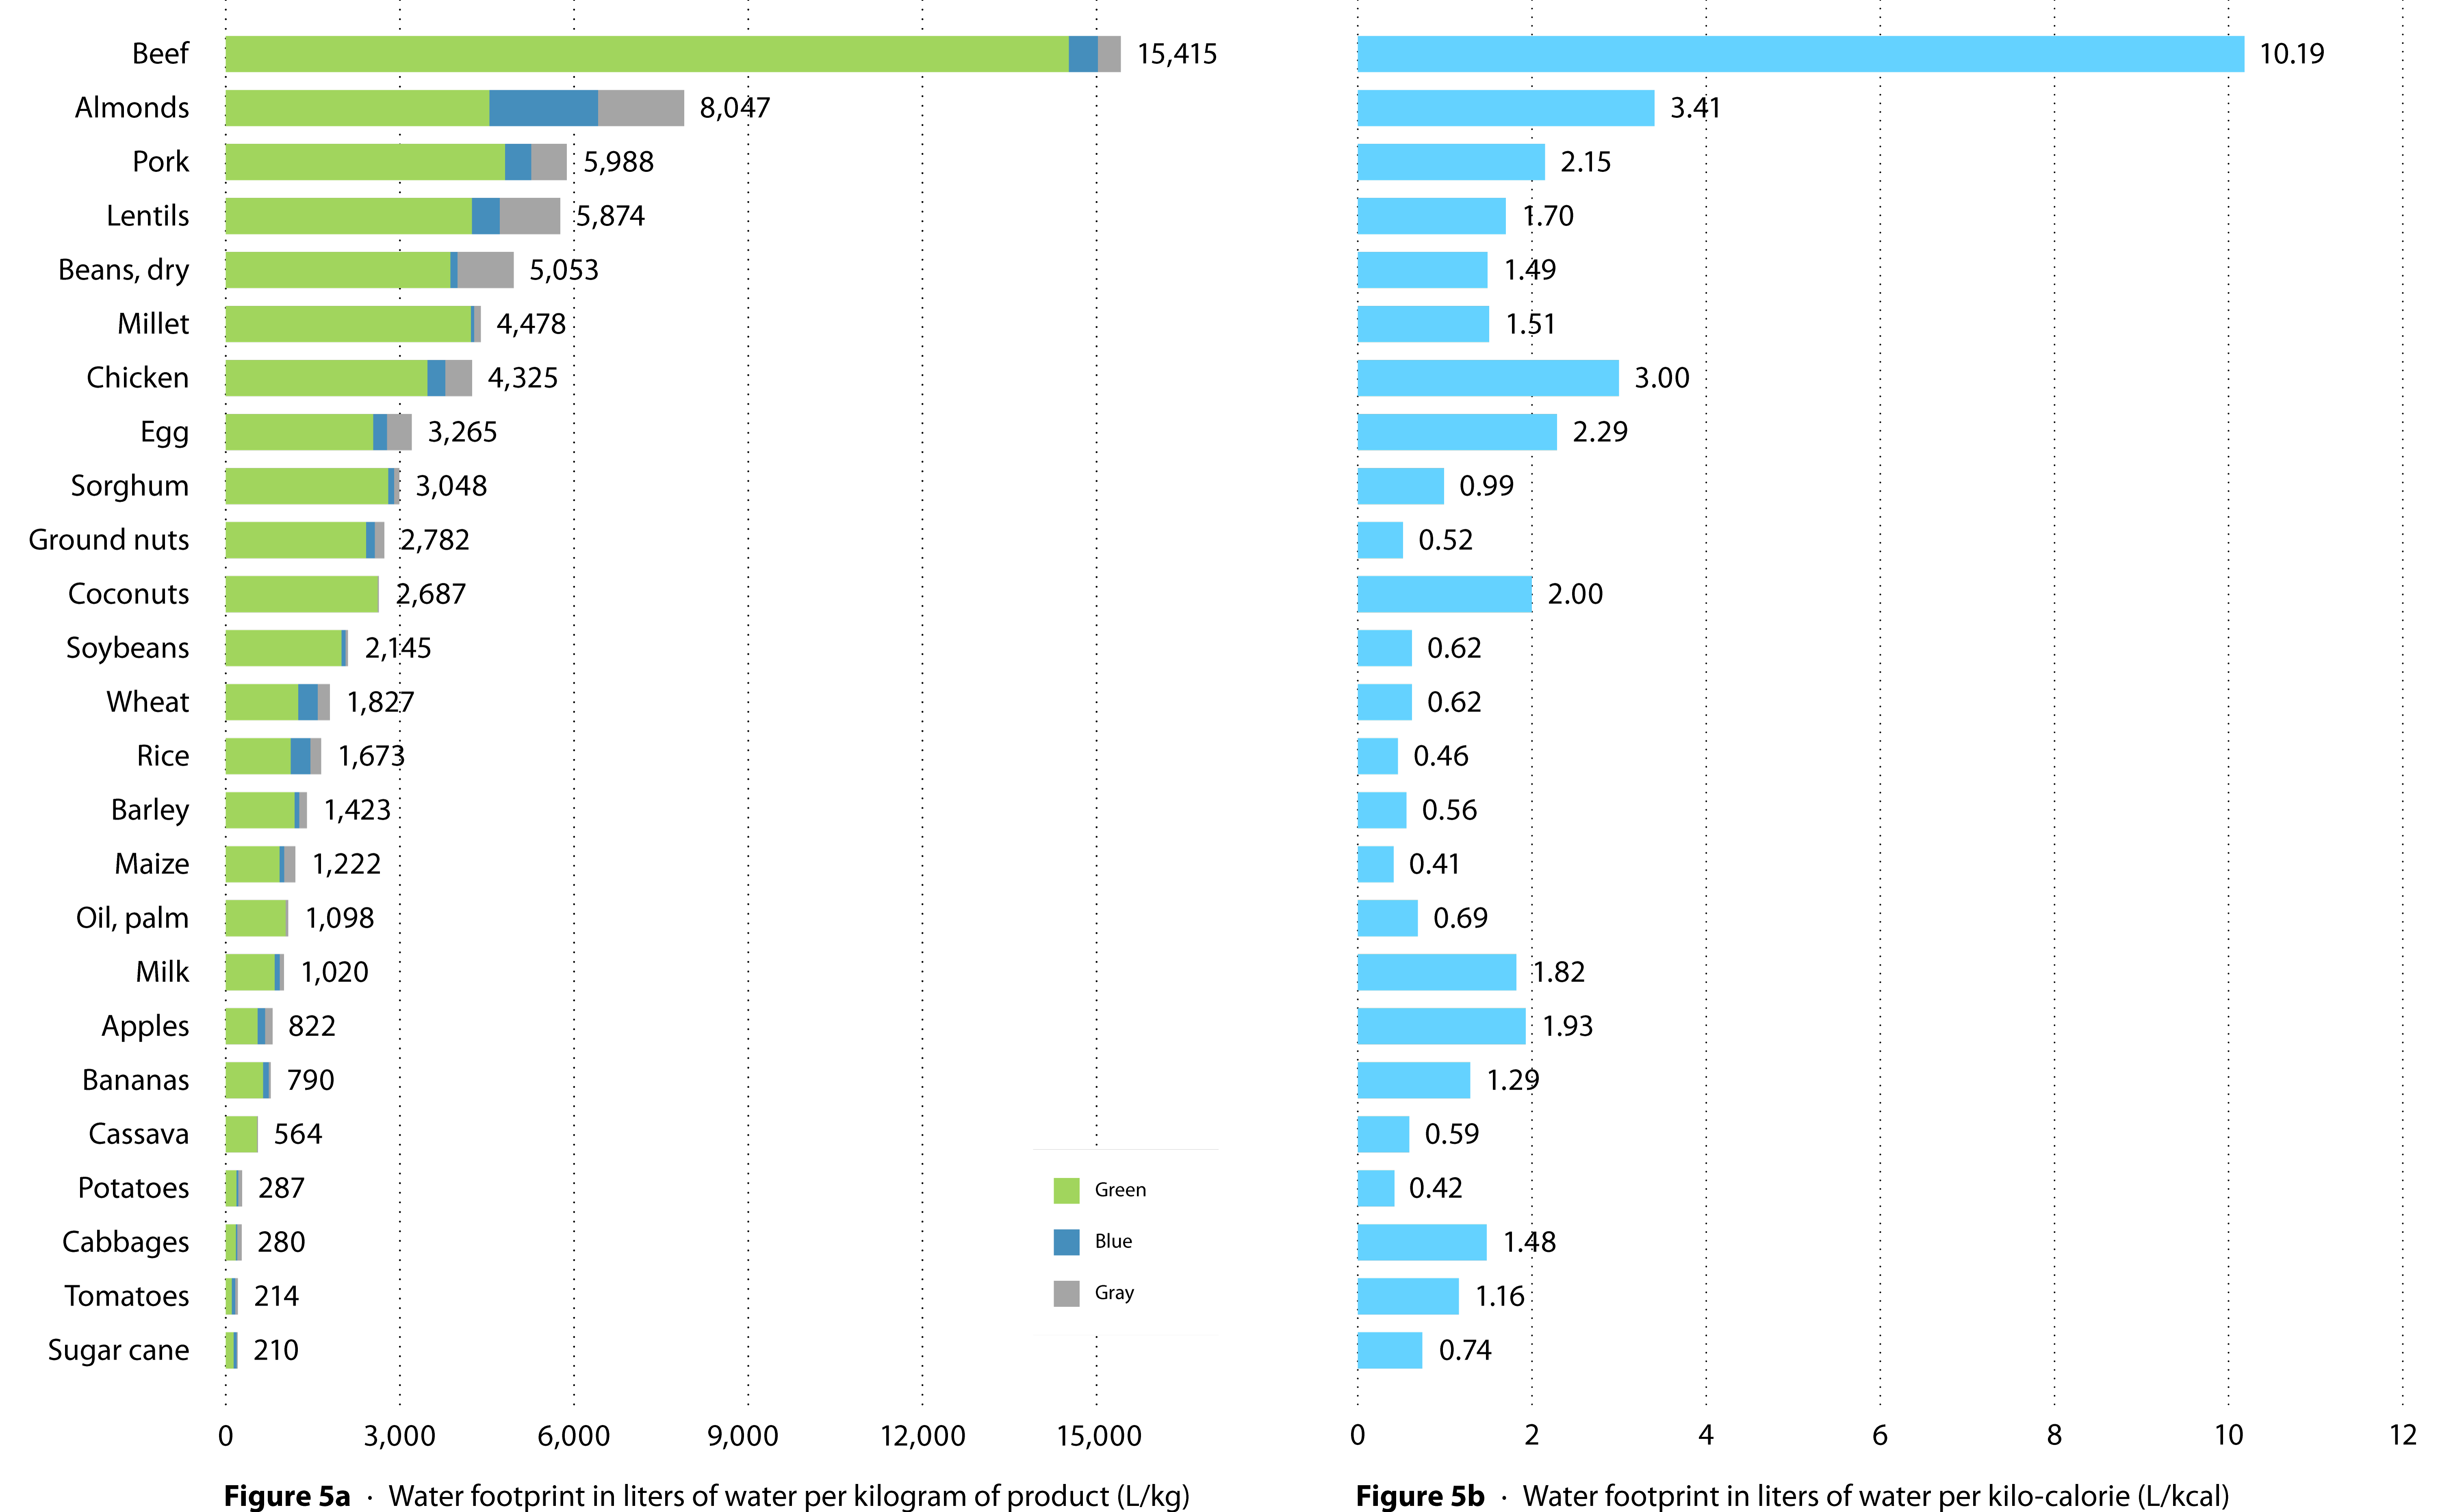
Figure 5 depicts the water foot print of key crops and animal products. Raising beef cattle consumes the most water, using an estimated 15,000 liters of water per kilogram of beef. Since 1961, cattle and meat (beef and buffalo) production has more than doubled globally. Poultry production has grown more than 12-fold, with the U.S., Brazil, and China being the largest producers.
Nutrients, including nitrogen, phosphorus, potash, and manure, are the largest pollution source from the Food Products industry. This is primarily from on-farm fertilizer use and off-farm food and slaughterhouse processing wastewater discharges. Global use of fertilizer nutrients rose significantly over the past 50 years to around 209 million tons of nitrogen, phosphorus, and potassium in 2019 [23], [24]. Manure use as a fertilizer on cropland, which increases nitrogen and phosphate runoff into water bodies, has also grown significantly. Manure nitrogen production from livestock increased about fivefold from 1860 to 2014.
Globally, pesticide use grew over 30% from 2000 to 2018, reaching 4.45 million tons in 2018 [25]. Agricultural runoff from crops increases the pesticide concentration in water bodies, while the runoff from livestock waste increases pathogens, organic matter, pharmaceuticals, and hormones (given to livestock to prevent disease and optimize growth).
Tillage and other farming land-use activities worsen soil erosion and salinity, polluting water bodies. Global annual cropland related soil erosion is estimated at about 11.57 tons per hectare, while pasture erosion is about 1.87 tons per hectare. Severe water-salinity issues due to irrigation have been reported in major food producing countries, negatively affecting water quality for about 1.1 billion people [26]. Food production is also a critical driver of deforestation worldwide throughout its supply chain, which further increases soil erosion in many regions, such as in the Amazon. In the Brazilian Amazon, 65% of deforestation can be attributed to cattle ranching [27], [28].
Freshwater impacts
Irrigation for agricultural food production is the dominant force driving global groundwater depletion. India uses the most water per day for agricultural irrigation, followed by China and the U.S [1], [21]. Among primary crops, nuts, rice, and sugarcane are the top three water consumers on a per unit basis. Although water abstraction trends for irrigation have decreased in most countries since 2005, crop-related irrigation continues to play a major role in causing water stress in many countries, including Turkey, Mexico, India, China, and the U.S. In India, which is more dependent on water pumped from groundwater aquifers than any other country, excessive pumping compounded by droughts is draining major aquifers that sustain more than 30 million wells [29]. In the U.S., the federal government declared a first-ever Tier 1 water shortage in 2021 for the Colorado River, where agriculture accounts for about 80% of water use primarily from the irrigation of over 5 million acres of farmland [30]. The declaration reduces the amount of water that Arizona, Nevada, and Mexico can claim.
Water pollution from phosphorus has become a severe issue in many river basins around the world, highlighted in yellow and red in Figure 6. Agriculture is the second largest source of phosphorus water pollution globally. The processing and packaging of food and meat are major contributors to water toxicity and eutrophication, especially from meat, which has seen a tripling in global production during the past 50 years. About 80 billion animals are slaughtered each year [32]. In China, manure and fertilizer runoff from meat producers caused widespread water pollution of major lakes, rivers, and coastal waters between 1980 and 2010, according to a 2018 study [33]. In the U.S., river basins have repeatedly suffered harmful algal blooms and massive fish kills from poultry and hog farm waste lagoons that overflow following extreme rain events.
Geographical hotspots
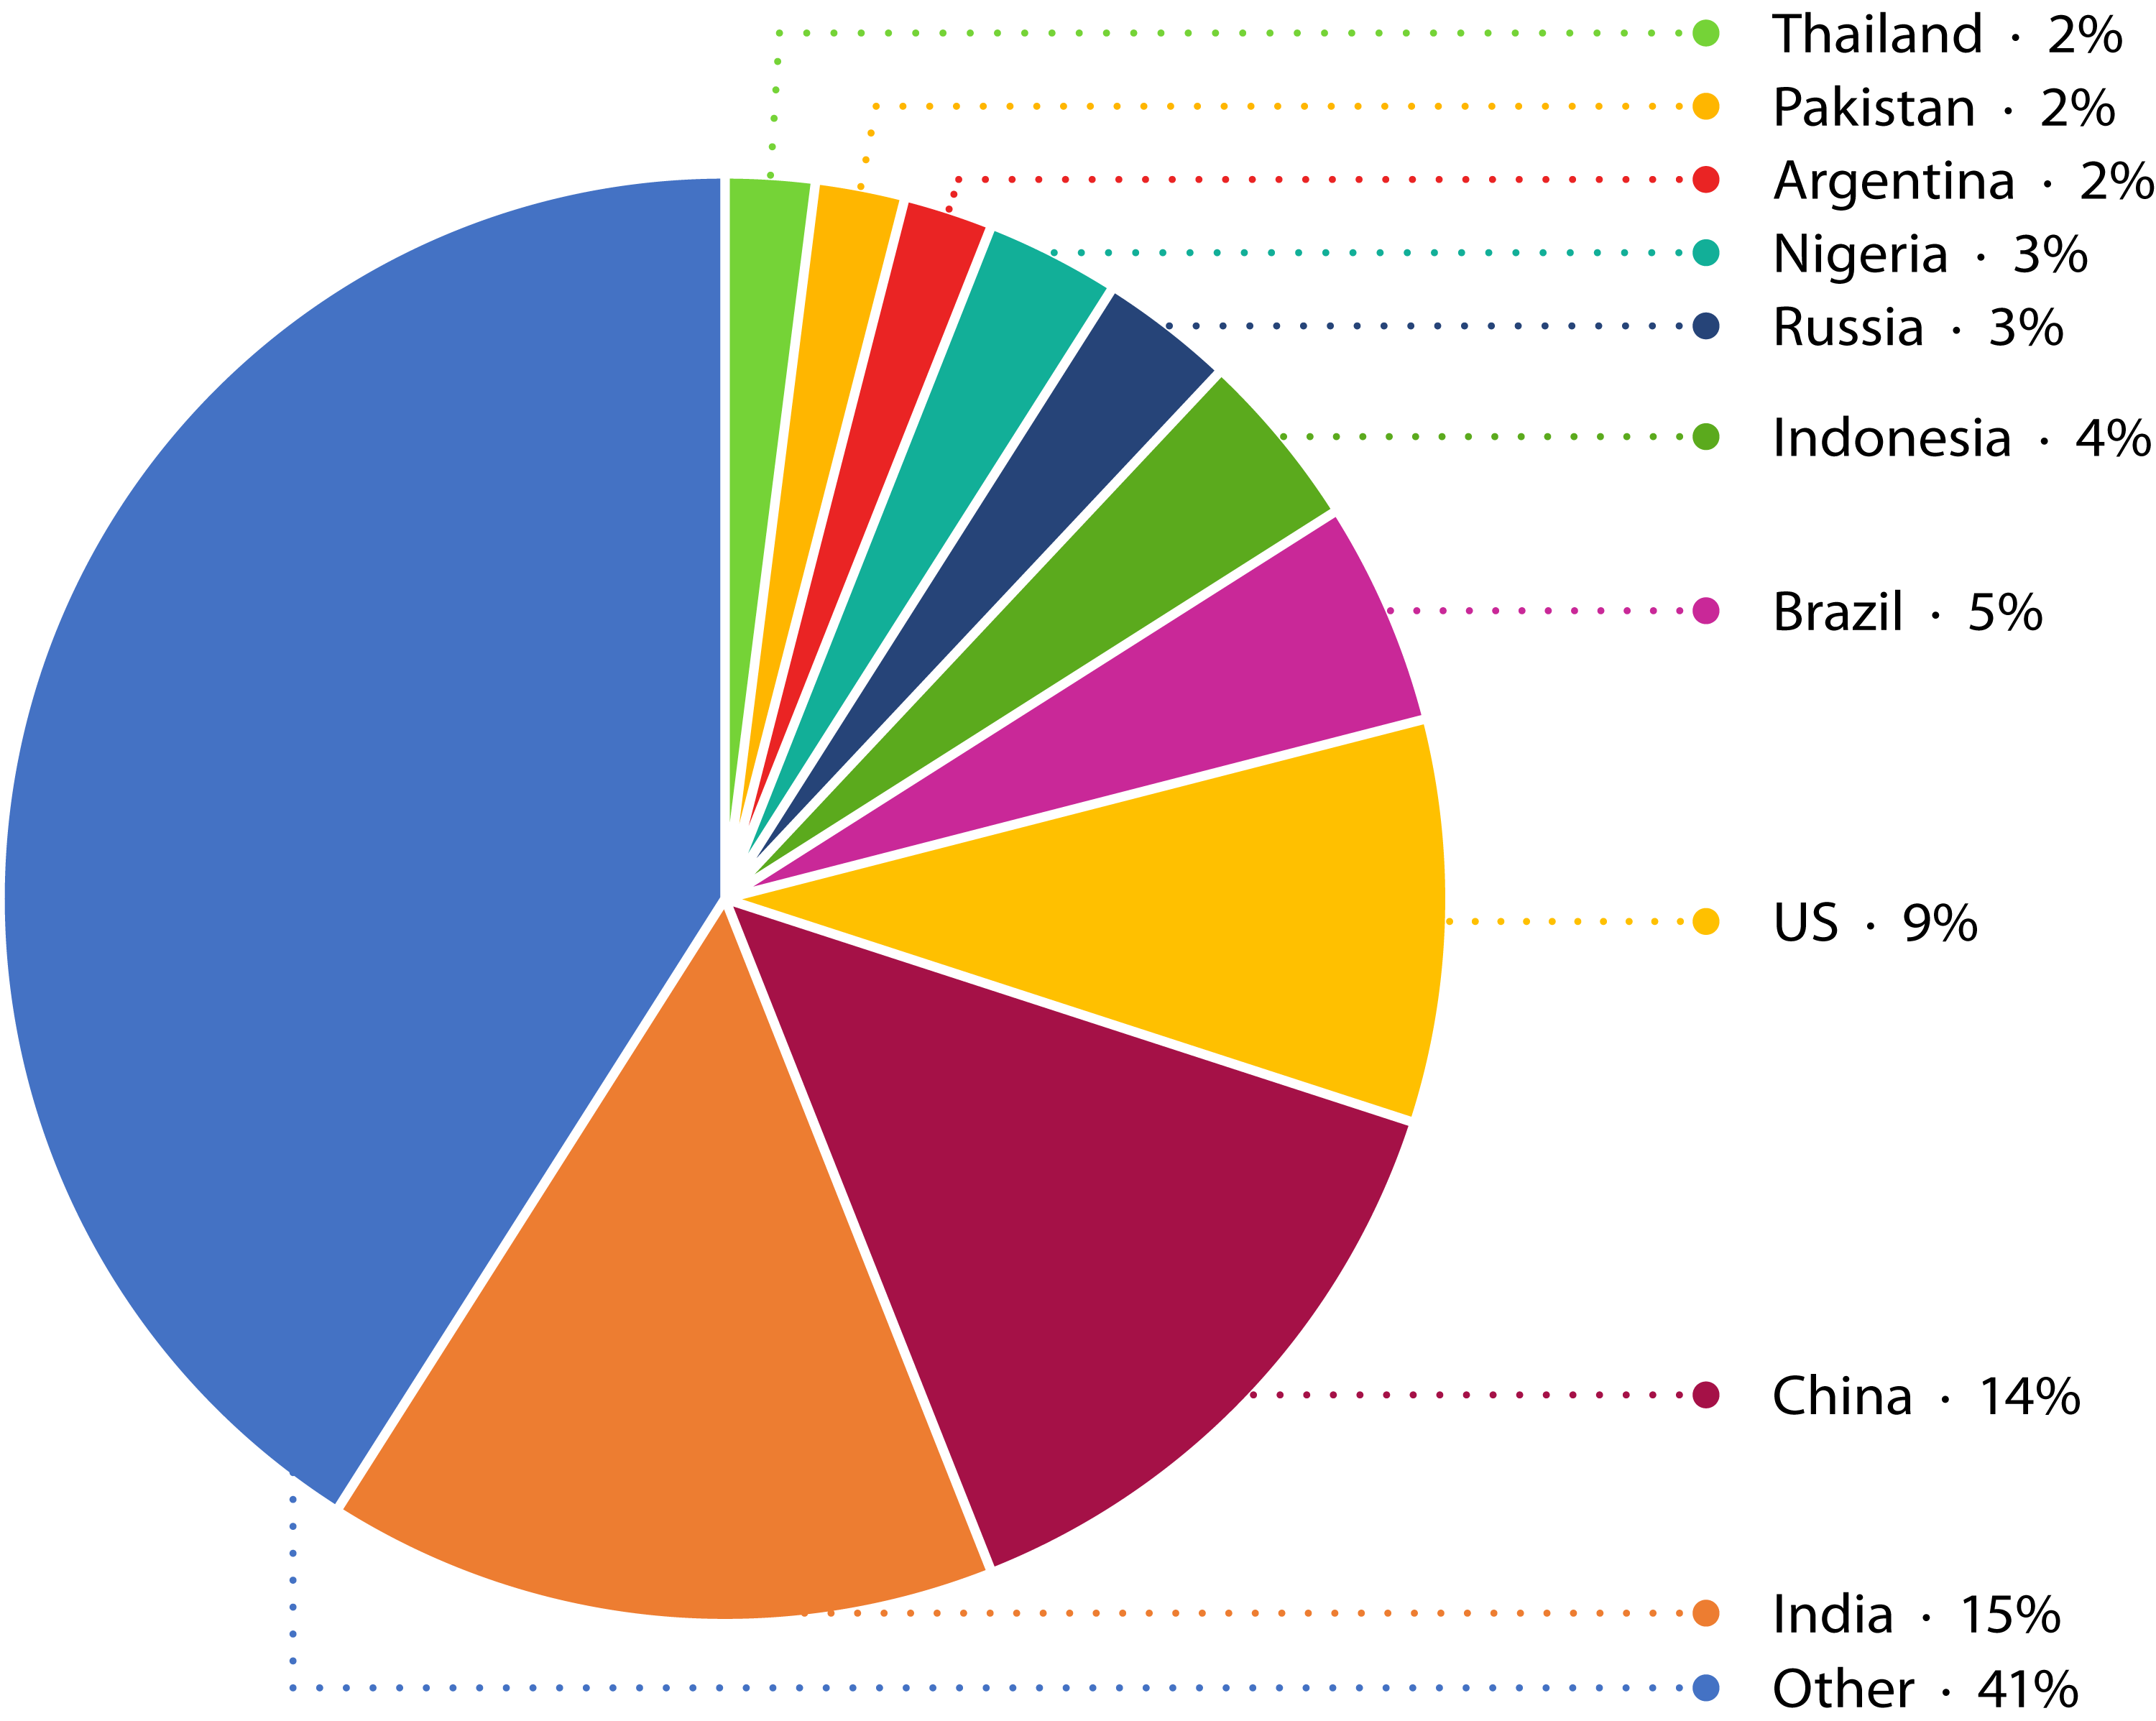
Global hotspots of water scarcity and pollution intensified by agricultural irrigation include the U.S. (especially the Great Plains and California), India (northern regions), Mexico (Central), and Northern China. Figure 7 below shows the total water footprint (WF) related to crop production for human consumption. The pie chart shows the major countries with a large share of the total global water footprint.
The largest fertilizer users are mostly in eastern Asia and Brazil. The main use of fertilizer in Brazil is for growing coffee beans, sugarcane, citrus, and soybeans. China is the largest user of fertilizer and pesticides in the world, with most of it used inefficiently [34]. Other hotspots for major fertilizer use are India and Indonesia, primarily for rice, groundnuts, wheat, sugarcane, maize, and palm oil production. The production of palm oil, a commodity used in nearly half of packaged products globally, has grown more than 25-fold in Indonesia in the past half-century, with excessive amounts of fertilizer being applied to the plantations.
Figure 6. The map shows the phosphorus loads from agriculture (37.9%), domestic (54.2%), and other industries (7.9%) during 2002-2010 [31]. Note: water pollution level for P over 1 means the phosphorus concentration exceeds standard.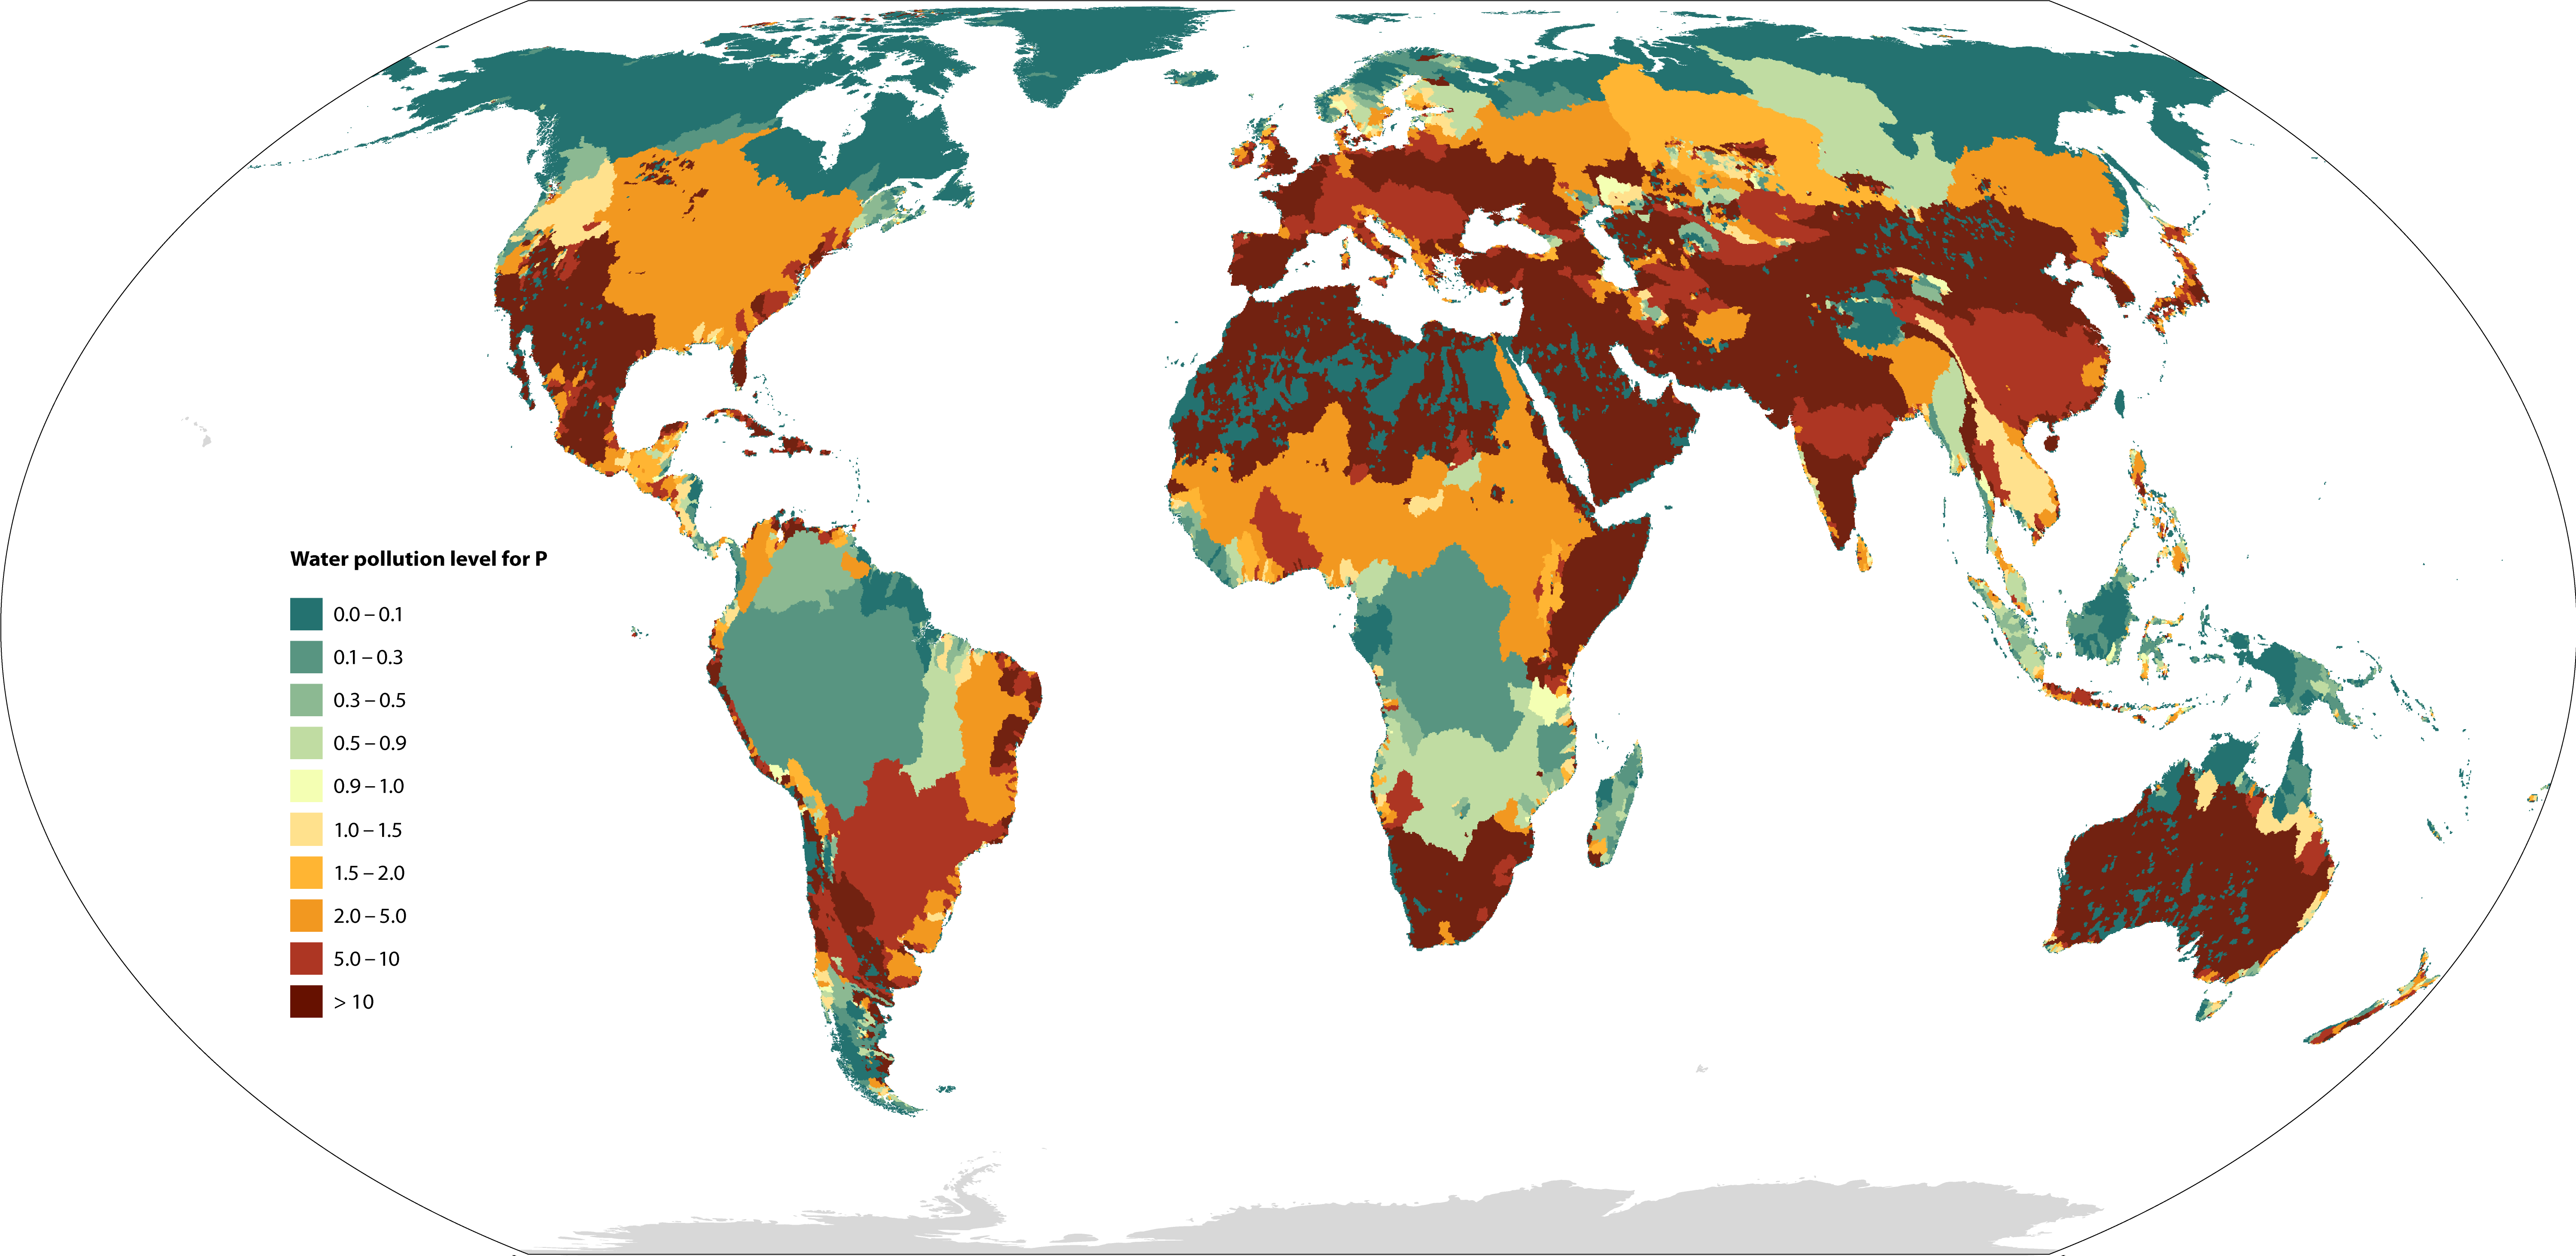
Figure 7. The map shows the total water footprint from crop production between 1996-2015. The pie chart (inset) shows the contribution of countries to total water footprint, with India, China, and the U.S. accounting for 38% of the total footprint [22].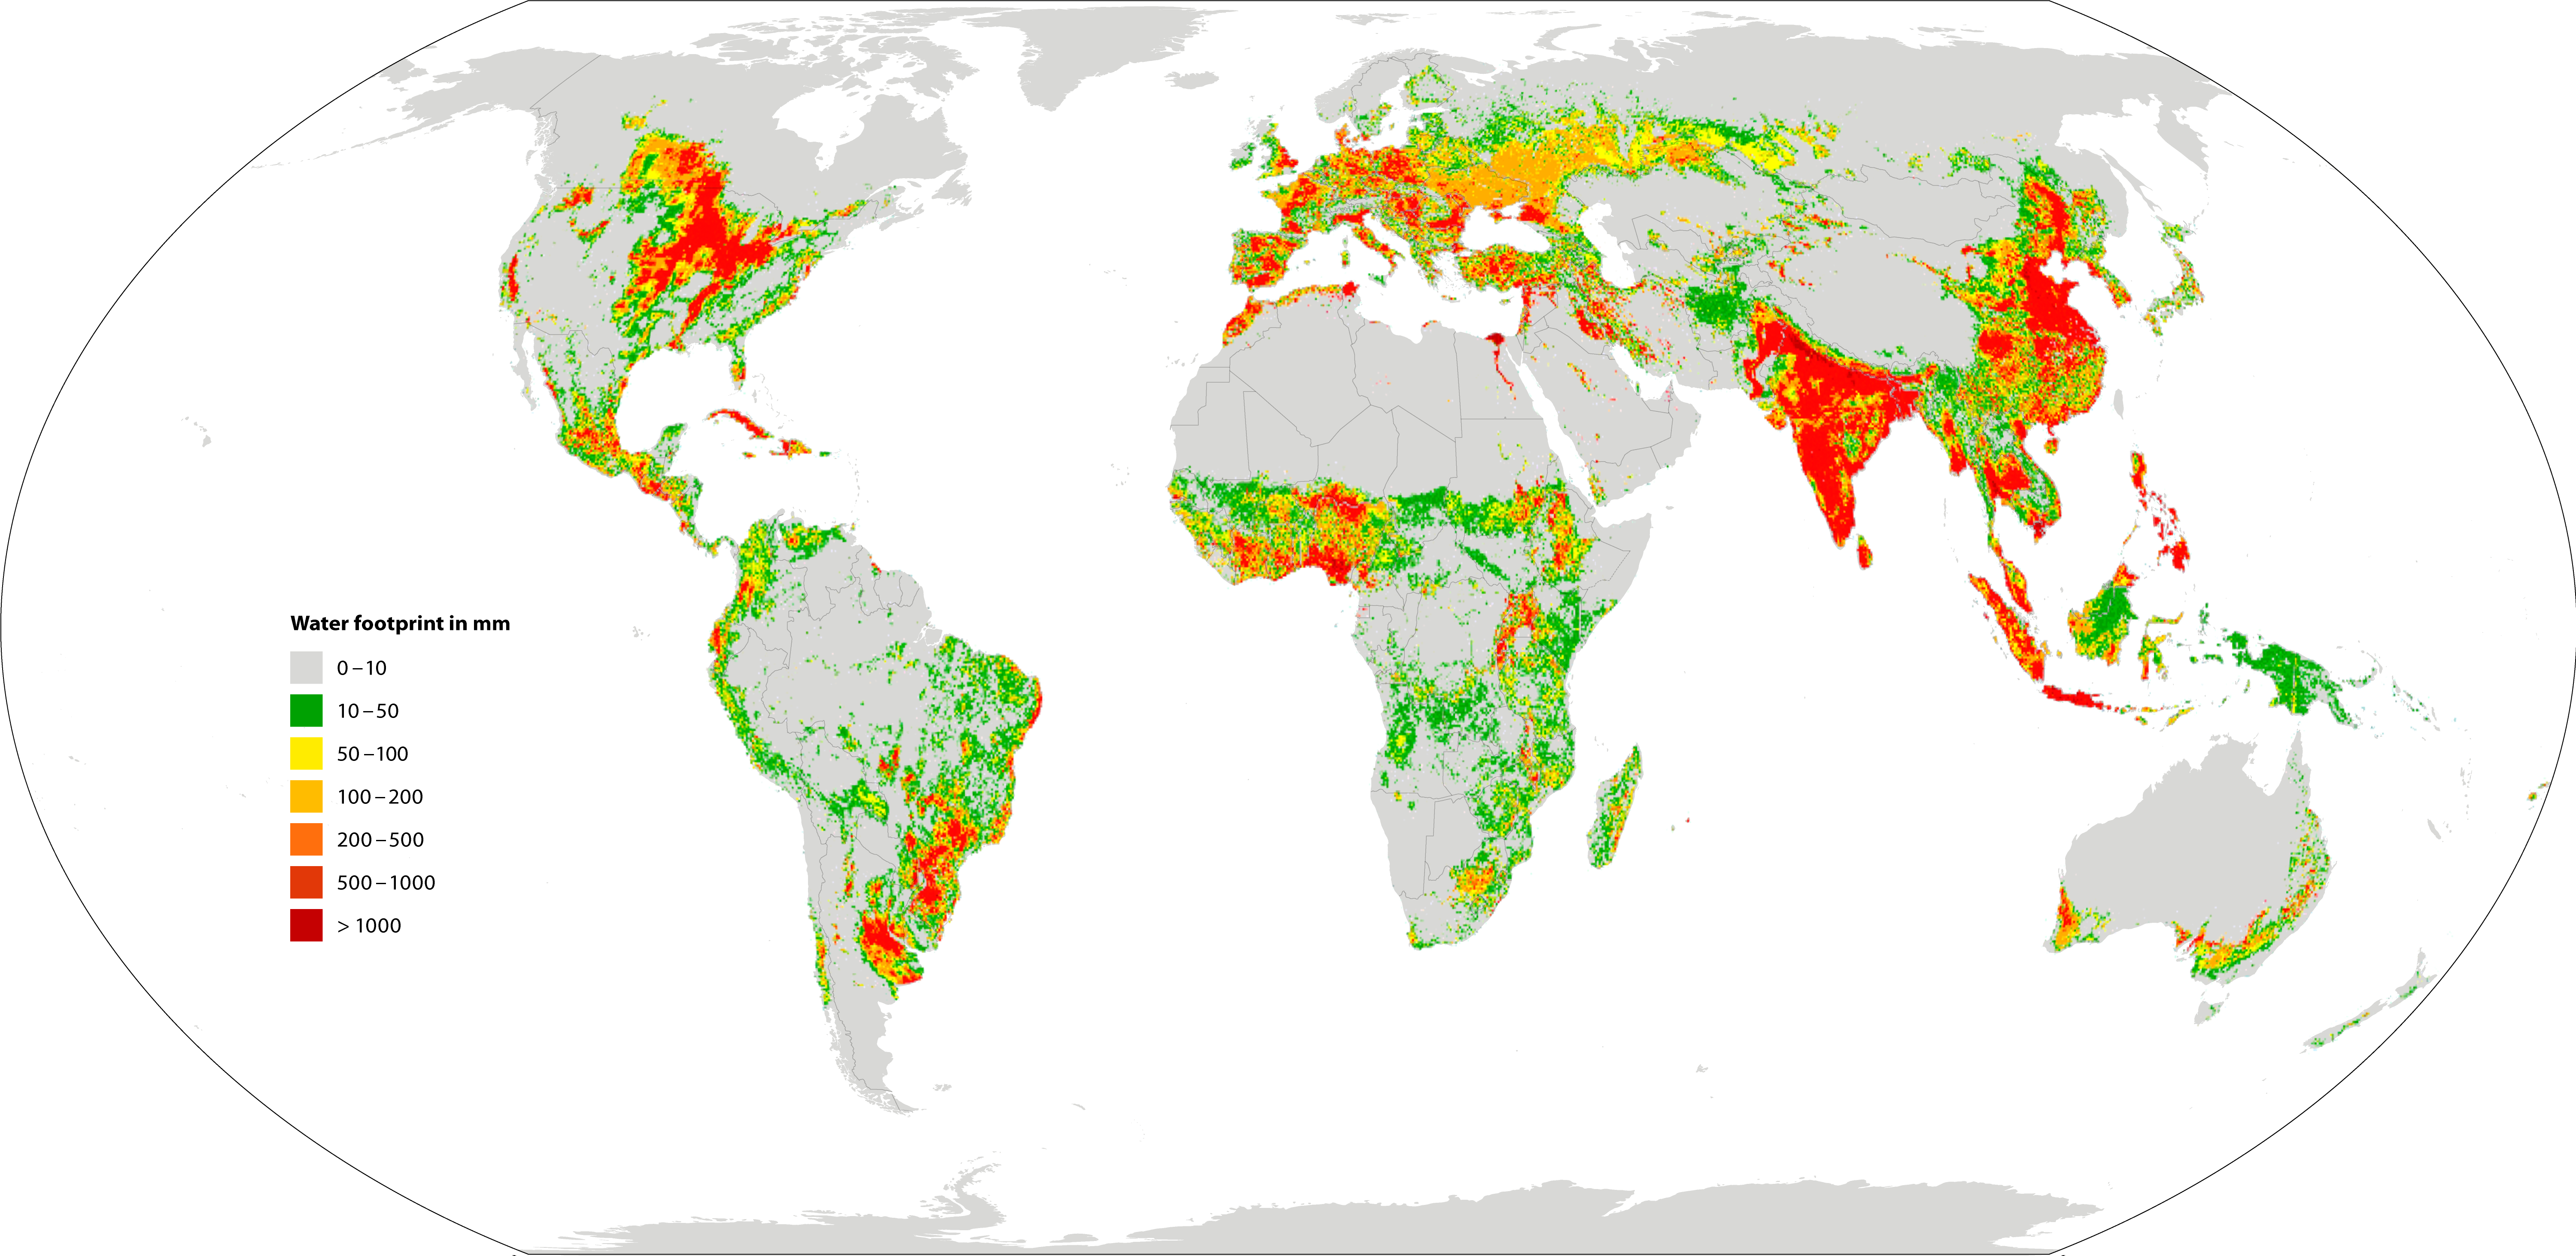
Beverage
The Beverage industry includes the production of soft drinks, bottled water, wine, beer, and distilled alcohols. Beverage manufacturing and the related supply chains consume water and discharge pesticides, herbicides, fungicides, and solid wastes into water bodies, while also negatively impacting oxygen levels, odor, and color.
Figure 8. Summary of Beverage industry freshwater impacts along its value chain, including on-farm production, manufacturing and processing, and consumer use. Selected hotspots are the regions frequently cited in the literature.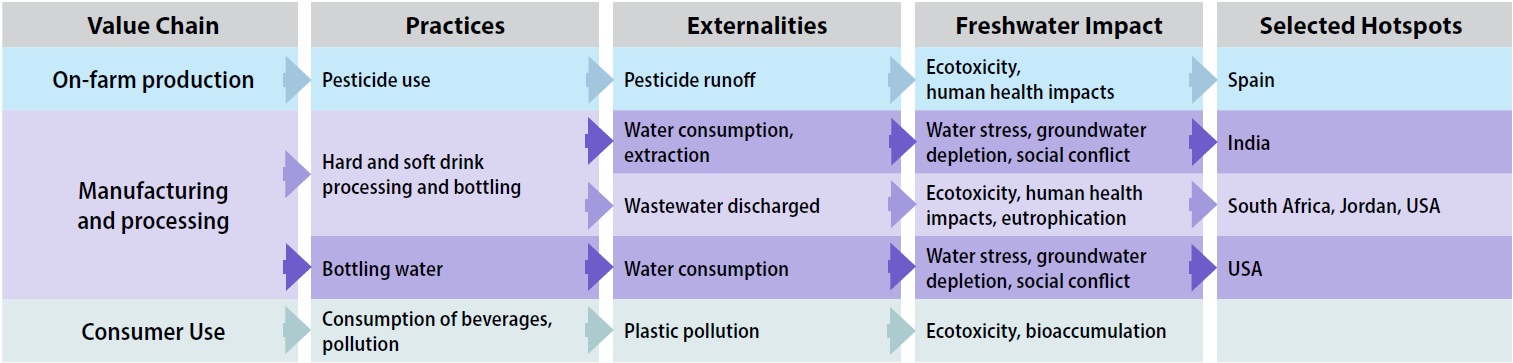
Practices and associated externalities
Water is required for nearly every aspect of beverage production, from growing ingredient crops, such as sugarcane, barley, grapes, and coffee beans, to packaging and bottling in factories. According to the Water Footprint Network, it takes at least 70 liters of water to produce 0.5 liters of soda, 74 liters for a glass of 0.25 liters of beer, and 132 liters for a cup (0.125 liters) of coffee. Around 18,900 liters of water are needed to produce 1 kilogram of coffee beans [35].
Ingredient cultivation is the most water-intensive practice within the industry. Nevertheless, the industry’s water footprint for manufacturing processes, such as wet milling, mashing, filtering, bottling, pasteurization, and cleaning, is significant, as water is a main ingredient of beverage products. Beer, for instance, is composed of 90% to 95% of water in mass [36]. These manufacturing processes are highly water intensive, especially wet milling. For example, corn wet milling generally requires approximately 1.5 m3 of freshwater per ton of corn [37].
The Beverage industry also generates a variety of pollutants in its agricultural supply chain and manufacturing processes. Pesticides used within the on-farm section of the value chain, and solid waste released from off-farm manufacturing are the main activities in the Beverage industry that contribute to pollution. The manufacturing processes also generate pollutants, such as total suspended solids (TSS), total dissolved solids (TDS), metals, and nutrients, which lead to high concentrations of biochemical oxygen demand (BOD) and chemical oxygen demand (COD), and plastics and salts that compromise water quality. If left untreated, wastewater discharges containing these pollutants can have a variety of water quality, ecological, and health-related impacts, such as surface water acidification, eutrophication, ecotoxicity, and groundwater contamination.
Freshwater impacts
The Beverage industry uses large amounts of water to produce ingredients and products, but water consumption can significantly differ among companies and varies geographically. The water consumed along the value chain of the industry depends on water availability in the location in which ingredients are produced and the technology companies deploy in their factories. For instance, to produce 1 liter of beer it takes 180 liters of water in Tanzania, 155 liters in South Africa, 61 liters in Peru, and 62 liters in Ukraine. Growing crops, including wheat and barley, account for about 90% or more of the respective water footprints. Growing these crops in water-stressed regions can trigger stress and competition between the company and local communities. These conflicts have led to bottling plant closures in India and U.S.
Pesticide and fertilizer use for growing ingredients contributes to high concentrations of toxic chemicals and eutrophication of water bodies. Many regions in the world, including in South Africa and Jordan, have reported that COD and BOD concentrations from beverage plant wastewater far exceed standard discharge limits. In South Africa, for instance, a brewery’s effluent had concentrations of COD (5,340.97 mg/L) and BOD (3,215.27 mg/L) that were both well over European Union discharge limits (125 mg/L, and 25 mg/L respectively) [38].
Geographical hotspots
Water overuse and pollution impacts related to this industry were found globally, especially in Africa (South Africa, Nigeria, Benin, Tanzania, Burundi, and Malawi), North America (U.S., Mexico, Canada, Cuba, El Salvador, and Haiti), Asia (Jordan, Thailand, India, Cambodia, China, Indonesia, and Laos), Europe (Spain, Italy, Portugal, Romania, Germany, and Ukraine), South America (Costa Rica, Brazil, Puerto Rico, Bolivia, Colombia, and Peru), and Oceania (Australia and New Zealand). As the Beverage industry continues to widen its offerings and overall demand continues to grow, the impacts on water availability and pollution from the industry will likely keep escalating, threatening the industry considerably.
2. Consumer Discretionary Sector
Key industries within the sector identified as causing significant impacts to freshwater resources include Textiles, Apparel, and Luxury Goods, Automobiles and Components, and Hotels, Restaurants, and Leisure. The Textiles, Apparel, and Luxury Goods industry was identified as having the most severe and systemic impacts. Others are included in Appendix E.
Textiles, Apparel, and Luxury Goods
The Textiles, Apparel, and Luxury Goods industry includes apparel, textiles, accessories, and footwear. Large volumes of water are needed for growing natural fibers and industrial manufacturing processes. Pollution from pesticide and fertilizer use during fiber cultivation contaminates freshwater bodies and is a significant water risk globally.
Figure 9. Summary of Textiles, Apparel, and Luxury Goods freshwater industry impacts along its value chain, including on-farm production, manufacturing, and consumer use. Selected hotspots are the regions frequently cited in the literature.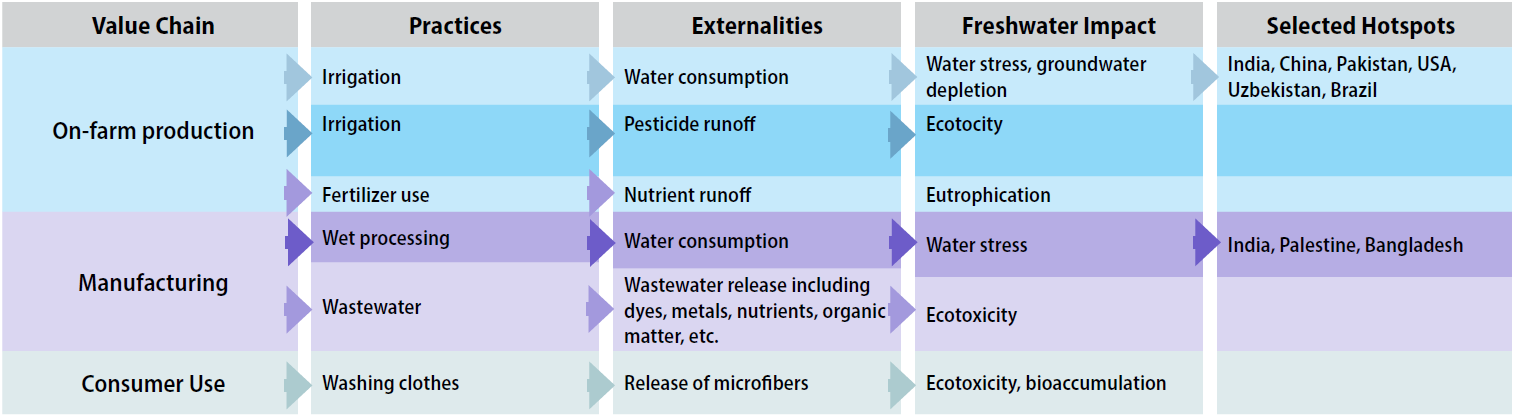
Practices and associated externalities
Across the entire value chain, clothes and textile production is enormously water intensive, withdrawing more than 215 billion m3 of water annually [39], equal to the total amount of water withdrawn by Indonesia [40].
Based on the life cycle analysis, on-farm cotton production is the largest consumer of freshwater for many apparel companies. On average, about 9.36 million liters of water is needed to produce one ton of cotton textile, and the production of one cotton T-shirt and a pair of jeans can require as much as 2,720 and 10,850 liters of water, respectively [41]. Organic cotton, which is primarily grown on small farms, uses 91% less water, according to a 2017 Textiles Exchange report. Within apparel companies’ manufacturing process, spinning uses the most water in viscose textile manufacturing, followed by pulping and presoaking [42].
The footwear industry requires more water for industrial manufacturing processes than for the production of raw materials. Water is critical for tannery and leather factories, particularly tanning, which accounts for up to 70% of total water use during manufacturing. Roughly 1 to 3 m3 of water is needed for every ton of hide produced, 4 to 8 m3 per ton for post-tanning, and 0 to 1 m3 per ton for finishing processes [43].
Pollution concentrations vary widely across the industry, depending on the raw materials and technologies used for production and on wastewater treatment. Pesticide and fertilizer use for on-farm ingredients generates many contaminants, including nutrients, pesticides, and pharmaceuticals. Contaminants are especially pervasive in cotton cultivation, which uses 16% to 24% of the insecticides and up to 40% of the pesticides applied globally [44].
Textile plants release numerous contaminants, including an estimated half-billion tons of microfibers from textile washing each year. Wet processing, such as dyeing, washing, printing, and fabric finishing in textile and tannery production, produces the most chemical pollutants [45].
Freshwater impacts
Cotton production for the apparel and footwear industries is water intensive and is accelerating water scarcity of groundwater and surface waters in water-stressed regions. Once the world’s fourth largest lake, the Aral Sea in Central Asia is now largely dried up due to widespread water extraction for cotton monoculture and cotton- related river diversion for irrigation. The United Nations has called it one of the world’s worst environmental disasters. According to WRI’s Aqueduct Water Risk Atlas in 2013, more than half of cotton production globally was in high to extremely high water-stressed irrigated regions, and the recent data on water and food security shows that the percentage could increase to over 70% by 2030[46],[47]. The production of ingredients, especially cotton, causes pesticide and nutrient pollution that is harmful to aquatic organisms and causes eutrophication. Pesticides have been found in many water bodies, including rivers and drinking water reservoirs, that are close to cotton cultivation areas[45]. Fertilizer runoff from cotton fields can result in 1,296-62,554 tons of nitrogen discharges into water bodies annually in a variety of countries [41][45],[48].
Untreated or insufficiently treated wastewater from textile plants can have wide-ranging ecological and health related impacts. Microfibers and colorants from textile wastewater discharges can cause diseases and conditions that include hemorrhages, skin ulcerations, nausea, severe skin irritation, and dermatitis. Dyes also contain high levels of trace metals that pollute water bodies.
Geographical hotspots
Countries that use large amounts of water for cotton production include India, Brazil, China, and the U.S., where it is a significant driver of groundwater depletion. The countries with the largest impact on external virtual water resources (the water embedded in cotton that is produced in and imported from other countries) are China, the U.S., Mexico, Germany, the U.K., France, and Japan. Roughly half of China’s water footprint for cotton is within the country, while the other half is sourced from other countries, primarily India and Pakistan. Water pollution from textile plants has been documented in India, Palestine, and Bangladesh. Many textile and tannery factories in these countries release untreated wastewater into rivers, streams, or embankments.
The global apparel market is expected to grow from $1.5 trillion in 2020 to $2.25 trillion by 2025, indicating that impacts on water will continue to grow across many geographies[49].
3. Energy Sector
The Energy sector includes oil and gas operations and fuels for energy generation. Drilling and hydraulic fracturing and integrated oil and gas production are practices that significantly contribute to water risks, especially water quality and availability. Key industries within the sector identified as causing significant impacts on freshwater resources include Oil and Gas and Consumable Fuels. The Oil and Gas industry has been identified as having the most severe and systemic impacts. The Consumable Fuels industry is included in Appendix E.
Oil and Gas
The Oil and Gas industry’s impact on water resources is pervasive across exploration, production, and delivery activities, including extraction (drilling and hydraulic fracturing, as well as produced water), processing, transportation of crude materials, refining, and retail.
Figure 10. Summary of Oil and Gas industry freshwater impacts along its value chain, including upstream and midstream activities. Selected hotspots are the regions frequently cited in the literature.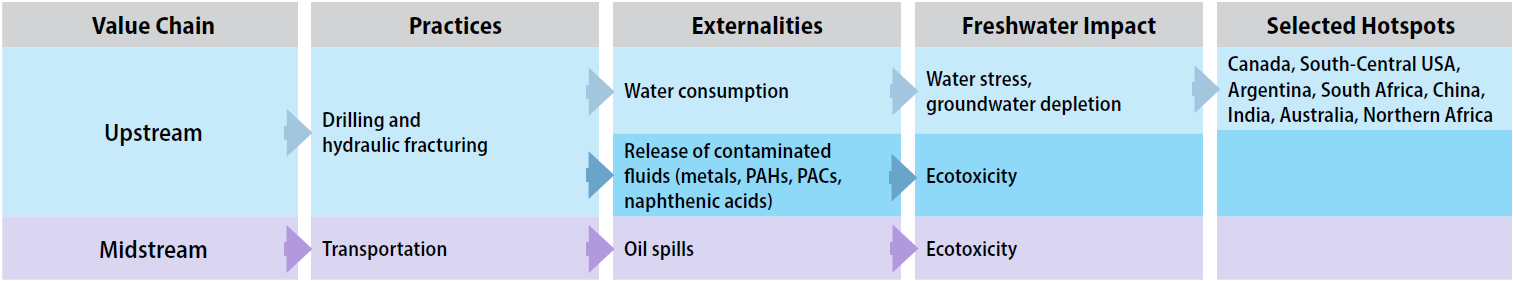
Practices and associated externalities
While impacts vary by geography, oil and gas shale extraction practices, including wastewater discharges, are the industry’s most intensive water impact by far. If left untreated and exposed to the environment, the industry’s wastewater will have various water quality, ecological, and health-related impacts, including surface water acidification, eutrophication, ecotoxicity, and groundwater contamination.
Hydraulic fracturing, a $35 billion global industry in 2019, can significantly pollute waterbodies[ 50]. Hydraulic fracturing involves injecting water, sand, and chemicals under high pressure into drilling wells and then reinjecting the process wastewater back into the ground after the extraction. Drilling and hydraulic fracturing lead to water contamination by introducing metals into groundwater, rivers, streams, and oceans. This process can also result in large volumes of fracturing fluid flowback to the water source or nearby water bodies. In Canada, contaminants typically migrate 3-5 kilometers from the contamination point in streams and rivers[51].
Drilling, extraction, refining, and logistics from oil and gas industry extraction technologies can also trigger water stress. The processes require large amounts of water -- an average of 15,141.65 m3 of water per well, according to the American Petroleum Institute – and can reduce the availability of freshwater resources near operating sites. Much of this activity is in water-stressed areas such as the Permian Basin, the most prolific oil field in the U.S. in West Texas.
Hydraulic fracturing affects groundwater aquifers more severely than surface water, although both are at risk. According to a 2016 Ceres report, 57% of the 106,000 wells that were hydraulically fractured over a five-year period were in regions with high or extremely high water stress, including basins in Colorado, Texas, Oklahoma, and California[52]. Globally, 59% of shale deposits are in the footprint of major freshwater aquifers and 20% of shale deposits are in regions affected by groundwater depletion. Figure 11 shows the regions globally where shale deposits overlap with high water stress aquifers.
Global map of water stress within shale deposits
Figure 11. Map shows regions where shale deposits overlap with high water stress aquifers. Values with water stress indexes greater than one are subjected to unsustainable water consumption [53].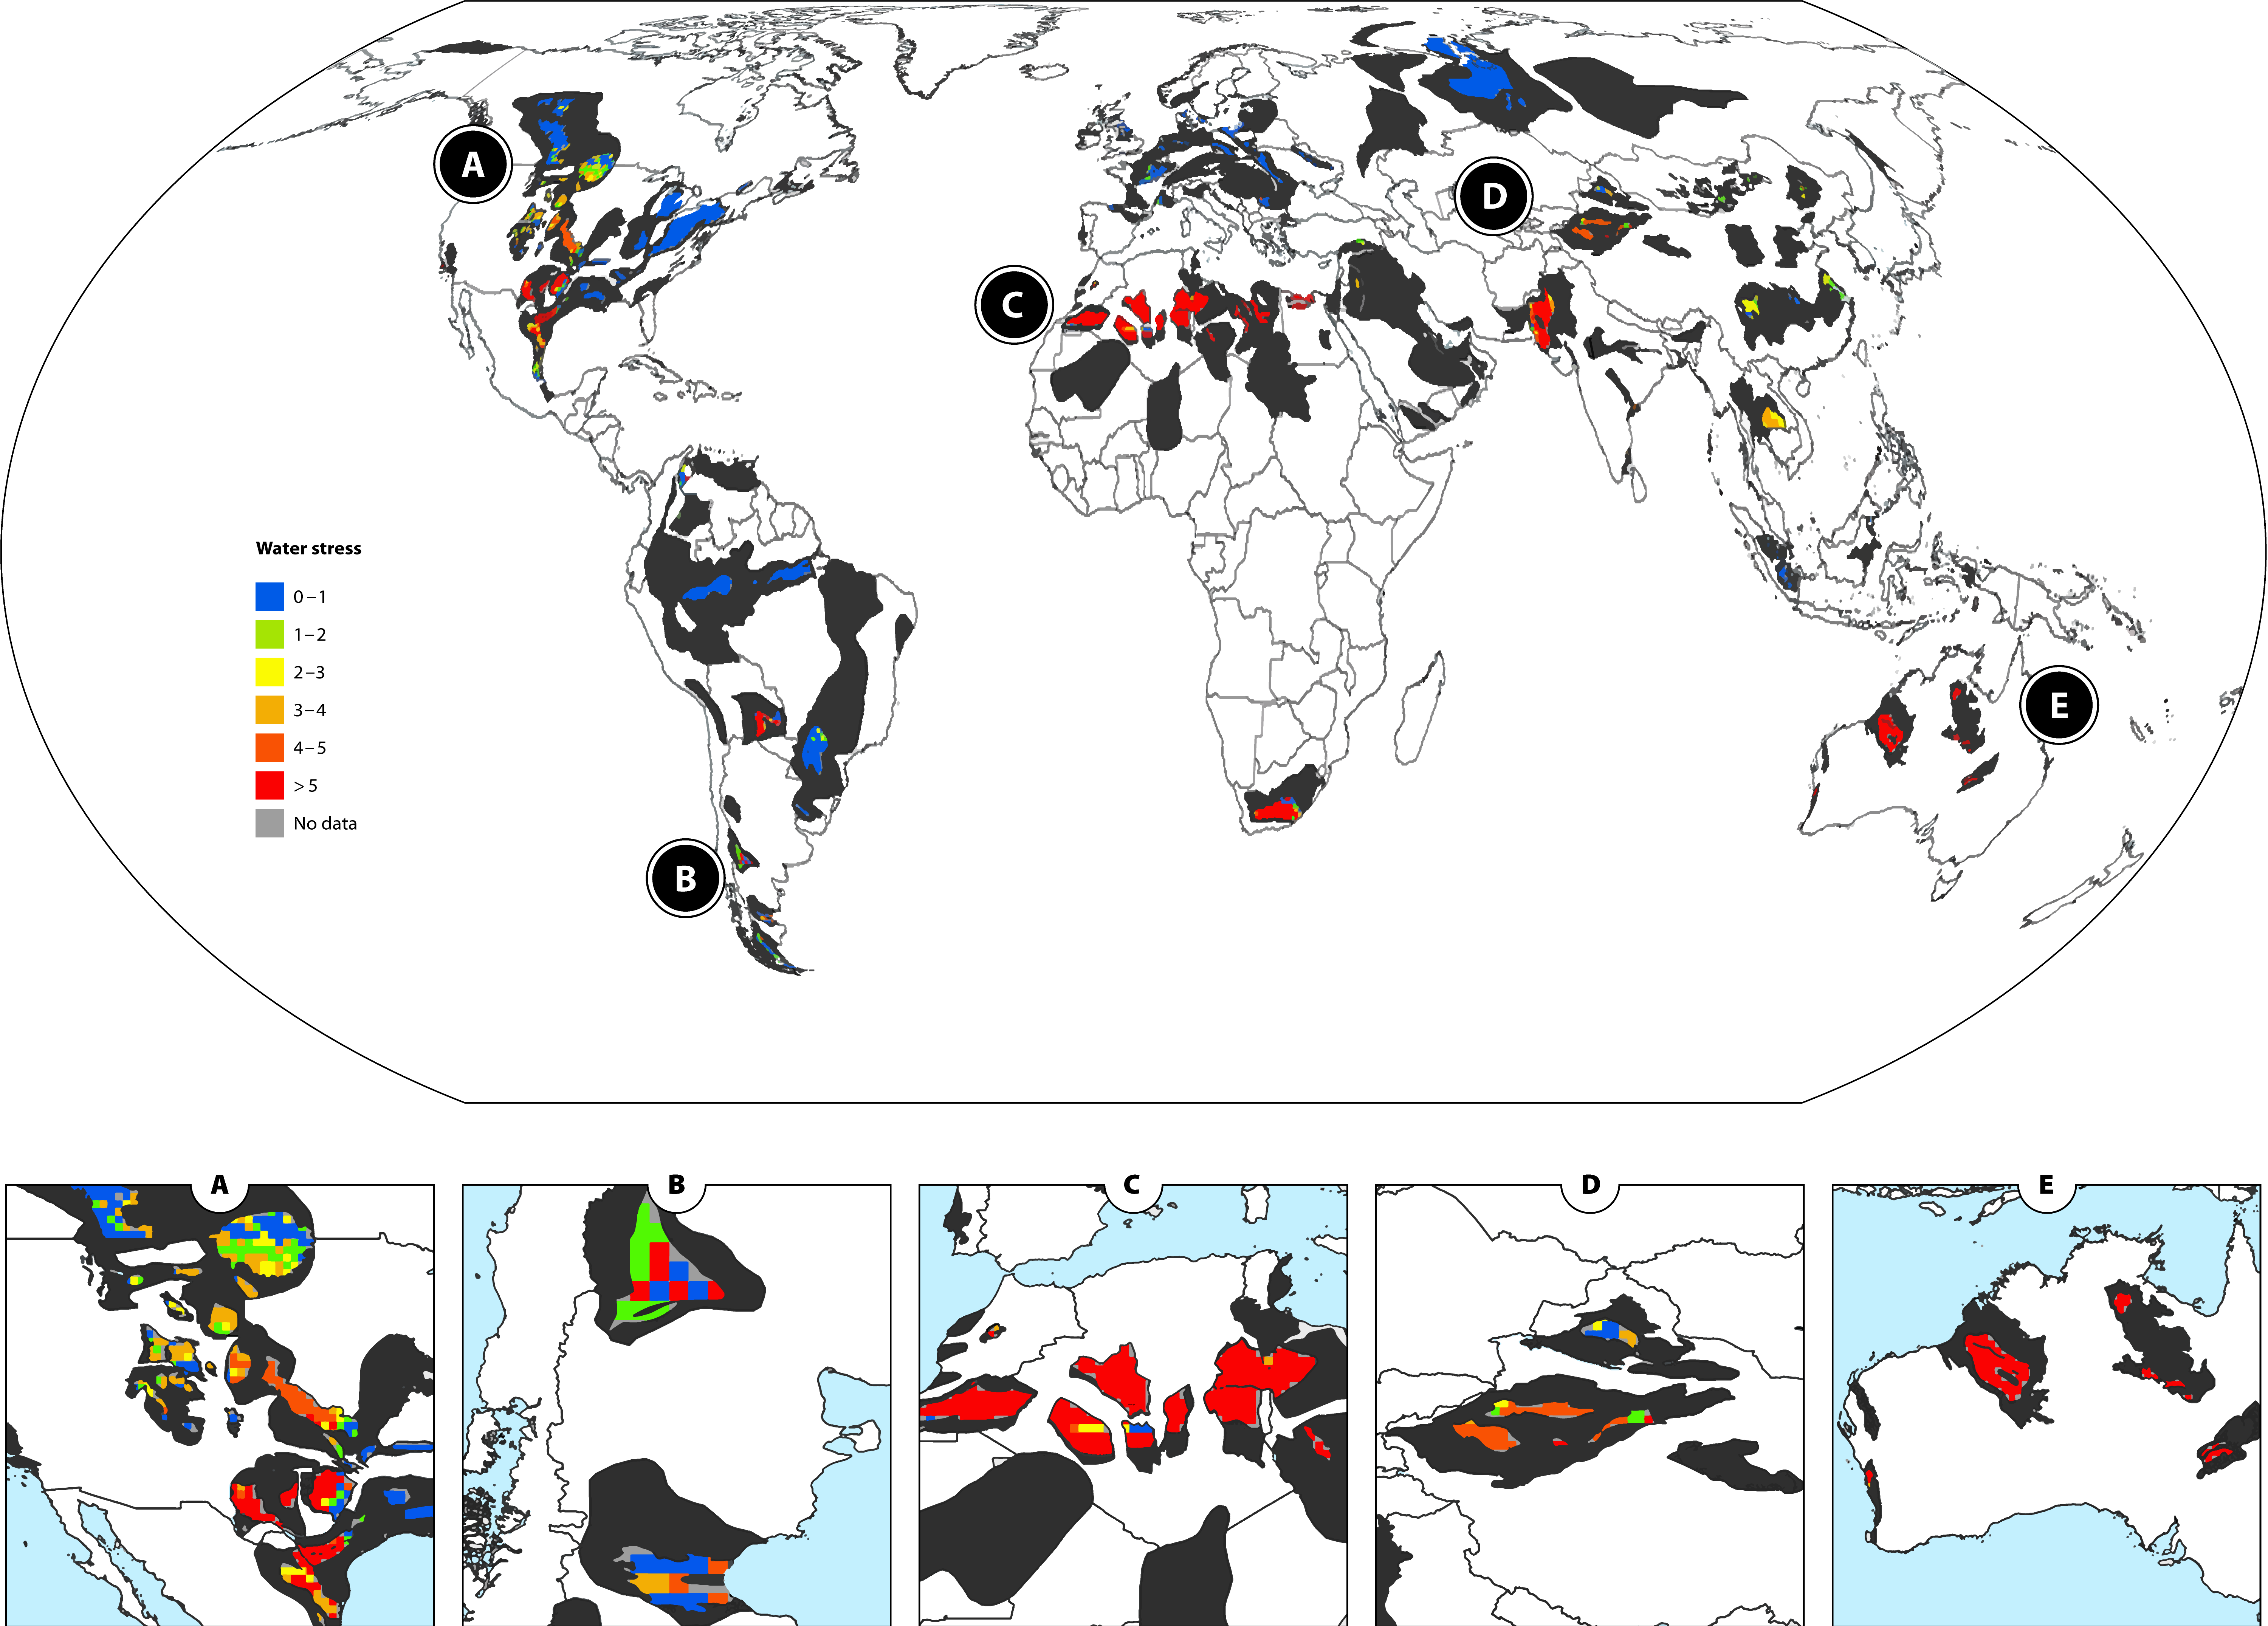
The oil sands industry also compromises the natural hydrology of streams, rivers, and lakes due to site clearing, water diversions, and draining wetlands. Massive toxic tailings ponds, which are commonly used in oil sands mining operations to store tailings materials that are recycled back into the extraction process, contain salts, suspended solids, and chemical compounds that are yet another risk for water pollution. These ponds pose threats to surrounding water bodies because they have the potential to fail and discharge contaminated water. The oil sand industry’s water footprint in Canada is significant, accounting for an estimated 9.6% of the country’s overall water use, based on multiple year averages.
Production, storage, and transportation of fossil fuels can also lead to oil spills, which have had enormous impacts on water quality, ecosystem health, and regional economies. In 2010, a pipeline transporting heavy crude oil broke in Marshall, Michigan and caused a spill of 4,200 m3 that polluted the Kalamazoo River[54]. Overall, in the U.S., from 2001 to 2020, there have been 5,750 significant pipeline incidents onshore and offshore, resulting in over $10 billion in damages[54]. The Niger Delta has experienced 7,940 oil spill incidents, of which 67% occurred onshore [55]. While the number of major accidents has dropped significantly since the 1970s, aging infrastructure and more pronounced extreme weather due to climate change will likely mean more accidents in the future as oil and gas production continues to surge globally.
Freshwater impacts
Hydraulic fracturing production has grown significantly in the past two decades, and affects groundwater aquifers more severely than surface water, although both are at risk. Drilling and hydraulic fracturing use large amounts of water that can reduce the availability of freshwater resources near operating sites. In the shale gas industry, large volumes of water are required to enhance the production of gas from the wells. In China, shale gas wells use an average of 26,580 m3 of water per well for drilling, completion, and processing, and the volume can go as high as 34,756 m3 of water per well in some fields[56]. In the U.S., shale gas wells use anywhere between 10,000-30,000 m3 of water per well for the same processes[57],[58].
The process of drilling also introduces metals, such as barium, cadmium, chromium, copper, mercury, lead, zinc, and titanium, into groundwater, rivers, streams, and oceans. Oil sands extraction generates toxic elements, including naphthenic acids, Polycyclic Aromatic Hydrocarbons (PAHs), and Polycyclic Aromatic Compounds (PACs). High concentrations of these elements in wastewater have contributed to water contamination in surface and groundwater systems.
Geographical hotspots
Shale oil and gas deposits in current water- stressed regions are mostly centered in the U.S., Canada, Argentina, South Africa, northern Africa, China, India, and Australia. In some arid regions, more than half of their regional water will likely be required for shale extraction in the future, including Cambay shale in India, Etel shale in Libya, Frasnian shale in Algeria, Tunisia/Gacheta shale in Colombia, Lower Silurian shale in Morocco, and Goowood/Cherwell shale in Australia. Locations worldwide are impacted by drilling and hydraulic fracturing, including in the U.S., Canada, and Norway. These activities in already depleted regions, such as in the south central U.S., northern India, and Pakistan, will accelerate the depletion of groundwater.
4. Health Care Sector
The Health Care sector is made up of industries that provide significant value to individuals in the global economy by maintaining human health and well-being. The industry within the sector identified as having the most severe and systemic impacts is Pharmaceuticals, which generates many chemical pollutants, including a wide range of emerging pharmaceutical compounds that affect water quality more than many other sectors.
Pharmaceuticals
The Pharmaceuticals industry includes companies that research, develop, or produce pharmaceutical drugs, including veterinary drugs, used to prevent and treat diseases in humans and animals. Pollutants traced back to pharmaceutical use are increasingly being detected in surface waters, groundwater, and soils globally. These pollutants bioaccumulate and are toxic to aquatic ecosystems and humans. When released in drinking water supplies, they also promote antimicrobial resistance (AMR), which can increase the potential of the spread of AMR diseases, threatening public health and creating associated societal costs. It is estimated that waterborne AMR costs between $1 billion to $5 billion annually in additional healthcare expenditures globally, with the Global South suffering the most [59].
Figure 12. Summary of the Pharmaceuticals industry freshwater impacts along its value chain, including ingredients production, manufacturing, and consumer use. Selected hotspots are the regions frequently cited in the literature.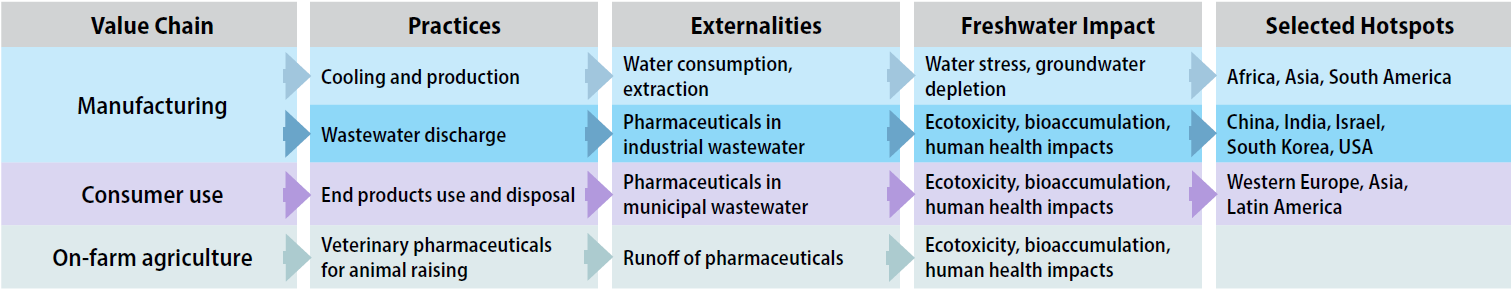
Practices and associated externalities
Pharmaceuticals, including over-the-counter and prescription drugs, are mostly being detected in surface waters, although they also pose a threat to groundwater, brackish water, sediment, and soil. A comprehensive estimate has pinpointed the presence of more than 600 pharmaceuticals in the environment globally, most of which are residues detected in surface water bodies [60].
Wastewater treatment plant discharges, originating from pharmaceutical manufacturing plants and households, are the main entry points for pharmaceuticals to get into water sources. Some 559 substances have been detected in treatment plant influent, effluent, and sludge [60].
Antibiotics are the most common pharmaceuticals detected in waters in many countries, with the highest concentrations found in surface waters near pharmaceutical production sites [61]. Other commonly found pharmaceutical groups include analgesics, anti-cancer, antidiabetics, anticonvulsants, antifungals, antihistamines, antiparasitics, beta blockers, endocrine disrupting pharmaceuticals, and psychiatric drugs.
Medicines used to raise animals are another growing source of pharmaceutical pollution worldwide. The use of antibiotics in livestock, which is already widespread, is expected to increase by 67% by 2030 across the globe, particularly in emerging economies [62].
While pharmaceutical manufacturing does not use water as intensively as other industries, it does use a considerable amount of ultrapure water (water of extremely high quality) for cooling and production, which potentially increases the risk of groundwater depletion. For example, from 2018-2019, the pharmaceutical company Pfizer used 5.32 billion liters of water per year for production at all Pfizer-owned and operated manufacturing sites [63].
Freshwater impacts
Drinking water sources polluted by pharmaceuticals can create potentially high risks for public health, including antimicrobial resistance. Absent action to address these risks, including by curtailing the overuse of antibiotics and increasing wastewater treatment capabilities, the number of people who die annually from drug-resistant infections is expected to jump from 700,000 during the past few years to 10 million by 2050 [64].
However, because non-effect concentrations (or the limit below which no adverse effects of exposure in an ecosystem are measured) haven’t been established for most detected pharmaceutical substances in freshwater, and potential synergistic effects from the combination of various chemicals are not fully understood, it is difficult to monitor and assess the risks of these pharmaceuticals enough to address or regulate their production and uses. There are tens of thousands of pharmaceutical substances, making these risks extremely difficult and costly to measure. Further, conventional wastewater treatment plants are not designed to fully remove pharmaceuticals from wastewater, creating additional challenges for mitigation [62].
Geographical hotspots
The top producers of pharmaceuticals include China, India, Israel, South Korea, and the U.S. Pharmaceutical production and use of ultrapure water in the production process can heighten the risk of groundwater depletion, particularly in areas of Africa, Asia, and South America.
Pharmaceutical pollution is contaminating water on all continents, with strong correlations between socioeconomic status of a country and higher pollution of pharmaceuticals in its rivers. The world’s most severely polluted countries and regions are those in sub-Saharan Africa, South America and parts of southern Asia [65]. High concentrations of pharmaceuticals in water that exceed national standards were found in several European countries and the U.S. Most of these were found in western Europe, where more than 30 different pharmaceuticals have been detected in tap or drinking water sources. Between 11 and 30 pharmaceutical substances have been found in drinking water in Canada, China, France, Sweden, and the U.S [60]. Given that over 75% of all pharmaceuticals have not yet been measured for in water, more comprehensive investigation is clearly needed in both developed and developing nations.
5. Materials Sector
The Materials sector is made up of industries that provide resources or raw materials for other industries. Key industries within the sector identified as causing significant impacts to freshwater resources include Chemicals, Metals and Mining, Paper and Forest Products, and Construction Materials. Among those, Chemicals, Metals and Mining, and Paper and Forest Products were identified as having the most severe and systemic impacts. The Construction Materials industry is included in Appendix E.
Chemicals
The Chemicals industry involves products used in other industries, including agriculture, consumer products, and textiles. It also includes companies or producers of commodity chemicals, diversified chemicals, fertilizers and agricultural chemicals, industrial gases, and specialty chemicals.
Figure 13. Summary of chemicals industry freshwater impacts along its value chain. Selected hotspots are the regions frequently cited in the literature.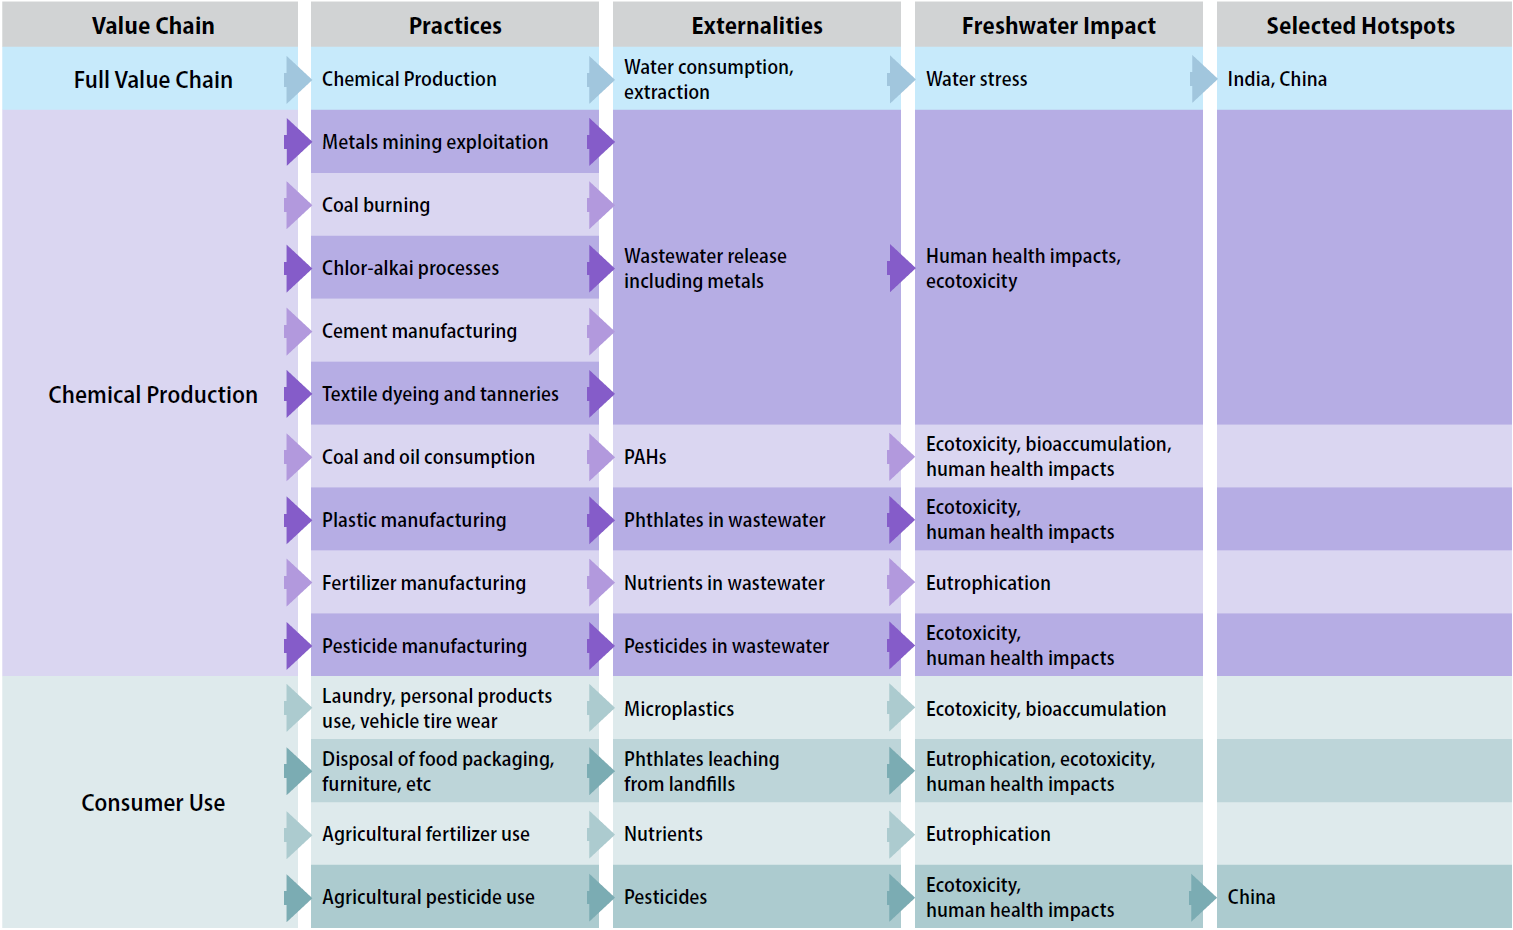
Practices and associated externalities
While chemical production requires significant water use, the Chemical industry’s main threat to freshwater is from the pollutants that are discharged into the environment. Pollution from the chemical supply chain enters water sources from many different avenues, including production of chemicals by the chemical industry itself, production by other industries of products using chemicals, and direct use of those chemicals across a variety of industries. The primary chemical contaminants released in water are heavy metals, polycyclic aromatic hydrocarbons (PAHs), microplastics, phthalates (PAEs), pesticides, and fertilizers.
- Heavy metals (mercury, cadmium, nickel, lead, zinc, copper, arsenic, chromium) are released in industrial wastewater from gold mining, coal burning, chlor-alkali processes, cement manufacturing, and textile dyes and tanneries, with mercury being the most prominent due to its persistence in the environment.
- Polycyclic aromatic hydrocarbons are toxic, known to bioaccumulate, and some are carcinogenic (to humans and animals), teratogenic, and mutagenic [66]. They are largely attributed to the oil and gas, chemical manufacturing, and electronic industries. PAHs are a main water contaminant in China and Mexico due to the drilling processes for industrial gases and minerals. PAHs can be ingested by humans through the intake of contaminated fish and shellfish and can be associated with poor fetal growth and cardiovascular disease.
- Microplastics end up in water bodies from numerous industries, practices, and products, including plastic manufacturing, paints, chemical additives, aging and lost shipping containers, and aquaculture products. This also includes waste resulting from consumer use of everyday products like soaps and makeup. Up to 14 million tons of plastic waste are transported in rivers to the oceans each year, globally [67].
- Phthalates, used for making furniture, food packaging, drug coatings, and other everyday products, are released into water sources from plastic manufacturing discharges and municipal waste runoff.
- Herbicides, insecticides, and fungicides are widely used around the globe as agricultural inputs. Atrazine, Dimethoate, and Carbendazim are the most commonly detected pesticides in water. Fertilizers are widely used for crop production, releasing nitrogen and phosphorus into water bodies through runoff. Estimates show that 50% to 70% of all nitrogen applied to crops is lost from the soil-plant system through soil leaching and erosion [68].
Freshwater impacts
Heavy metals, which are acutely toxic and bioaccumulate, can cause nervous system damage and impair cognitive and physical development. PAHs can be carcinogenic, bioaccumulate, and have potential mutagenic and genotoxic effects. Phthalates are endocrine disrupting chemicals with potential teratogenic, mutagenic, and carcinogenic properties. Pesticides are persistent, acutely toxic, and carcinogenic, cause endocrine disruption, and impact photosynthesis and other physiological properties. Fertilizers cause eutrophication, hypoxic and anoxic conditions, and reduced light penetration in water bodies, significantly impacting fish and organisms and drinking water quality.
Geographical hotspots
The Chemicals industry has ubiquitous impacts on water environment. Countries throughout Asia, particularly India and China, use extensive amounts of water directly and indirectly throughout the chemical value chain. On the pollution side, China uses the greatest amount of coal and petroleum in the world, contributing to PAHs contamination of surface waters. Sixteen PAHs compounds detected in China’s surface water bodies surpass the EPA’s acceptable drinking water limit [69]. According to a comparative review of studies on major pesticide consuming countries, high concentrations of pesticides were found in drinking water sourced from many major rivers in China, Japan, Malaysia, and India [70].
Metals and Mining
The Metals and Mining industry includes the extraction and processing of aluminum, copper, gold, silver, steel, and other precious metals and minerals.
Figure 14. Summary of metals and mining industry freshwater impacts along its value chain. Selected hotspots are the regions frequently cited in the literature.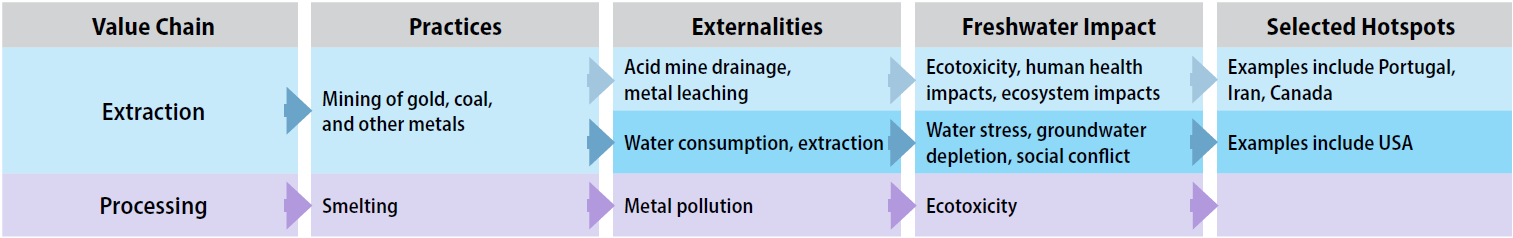
Practices and associated externalities
Raw mineral extraction has many impacts on water bodies, especially on water quality. Core pollution impacts include acid mine drainage, heavy metal contamination, and leaching. Acid mine drainage, largely associated with gold and coal mining, occurs when the mineral pyrite contacts oxygenated water, such as in rainfall. Heavy metals contamination for arsenic, cobalt, copper, cadmium, lead, silver, and zinc is especially common at mining sites. Gold and arsenic mining also cause arsenic contamination of groundwater. Metal processing and smelting release metal contaminants through industrial wastewater.
Mining activities also require considerable freshwater resources. In Chile, the world’s largest copper producer, the mining industry withdraws an average of 70 m3 of fresh water to produce one metric ton of copper.
Freshwater impacts
The impacts from the mining industry on freshwater supplies are widespread. Mining-related pollution, caused primarily by mineral extraction, is toxic to wildlife and can cause biodiversity losses through multiple pathways, both locally and globally. Mining pollution also impacts human health and communities’ well-being, including some indigenous communities. One indigenous community living near an abandoned mercury mine in the U.S. had an average blood mercury level of 15.6 mg/L (where normal levels are between 10-20 micrograms/L), heavily tied to the consumption of contaminated fish [71]. In the Brazilian Amazon, Tribal and Nahua People have long been exposed to mercury poisoning due to intensive mining activities in the area [72].
Mining activities are causing a decrease in surface and groundwater availability in many parts of the world, with more severe impacts in water-stressed regions. Mining activities have caused severe groundwater depletion in western Australia, South Africa, and Peru [73],[74]. Extensive mining activities in the Canning Basin in western Australia caused the world’s third highest rate of groundwater depletion [74]. The declining freshwater availability in many regions has caused increased competition between mining companies and local communities. The struggle between the largest mining companies and communities is evident in many places globally, such as the conflict in Cajamarca in Latin America [75].
The development of mining sites can spur people to migrate from other regions, upending local communities, creating competition for water and land, and raising living costs. For example, booming bauxite mining in Guinea in western Africa, which turned the country into a top global exporter, attracted a throng of new residents outside the mining sites, leading to reduced water levels and water-related riots [76].
According to a 2019 CDP survey of the world’s largest mining companies, 27% of production and up to $50 billion in revenues are likely to be exposed to high levels of water stress risk by 2030. More companies are resorting to using greater amounts of seawater desalination, which has its own environmental concerns, and water recycling to hedge against possible disruptions to operations. For example, copper mining in Chile consumes 15.4 m3/s of freshwater, 15% of which is from raw and desalinated seawater. Using seawater has increased from 1.3 in 2013 to 2.3 m3/s in 2015. The Las Luces copper-molybdenum plant in Chine has successfully operated using seawater as the sole source of water for over 20 years [77].
Geographical hotspots
Metals, which can be toxic in relatively low concentrations, are a growing threat to human health and wildlife, especially in developing countries lacking environmental regulations and proper wastewater treatment facilities. Mining impacts on freshwater availability are reported in many developing countries, including Peru, Chile, Saudi Arabia, Morocco, Western Sahara, Namibia, and South Africa. Mining companies in these regions face high water risks. Heavy metals, much of them released through mining extraction and processing, have been detected globally in rivers and lakes, with the highest concentrations in Africa, Asia, and South America, and lower levels in Europe and North America.
Paper and Forest Products
The Paper and Forest Products industry includes all sub-industries involved in paper manufacturing and other wood products, including the cork, forestry, cellulose, pulp and paper, wood, and timber sub-industries. These industries have a wide reach due to their usage in construction, paper, wood products, and fuel.
Figure 15. Summary of paper and forest products industry freshwater impacts along its value chain. Selected hotspots are the regions frequently cited in the literature.
Practices and associated externalities
Global water consumption by the Paper and Forest Products industry has risen from 768 billion m3 per year in 1961-1970 to 961 billion m3 per year in 2001-2010 [78]. This industry consumes and pollutes large amounts of water in the production of lumber, pulp, paper, fuel, and firewood products, involving a wide range of practices from wood harvesting to end-product processing, such as cooling, sealing, lubrication, and heating. Pulp and paper mills consume a large volume of water to produce paper products. Based on available data, the consumptive water footprint of producing an A4 Sheet paper, used for printing and writing, ranges between 2-13 liters (300-2,600 m3/ ton paper), depending on location and type of wood used [79]. In China, the production of tissue paper consumes more water than any other type of paper, followed by printing paper. Nonwood pulp-based papermaking consumes at least two times more water than wood and bamboo pulp-based papermaking [80].
Pulp and paper production is also one of the biggest contributors to freshwater pollution, especially from paper processing-related PAH discharges. Paper processing plants also release fluorene, anthracene, naphthalene, fluoranthene, phenanthrene, and pyrene in wastewater. Pulp mill effluent can cause excessive biological and chemical oxygen demand, and includes many contaminants, including PCBs, adsorbable organic halides (AOX), ammonium, phenol, sulfur, metals (iron, chromium, mercury), oil and grease, biocides, and resins [81].
Freshwater impacts
The Paper and Forest Products industry can have a wide range of negative impacts on freshwater systems. Sourcing wood materials results in forest degradation or deforestation, which further disrupts regional hydro-climatic patterns by altering movements of air, water, and heat through evaporation and transpiration. These disruptions can dramatically impact temperature and precipitation both locally and thousands of miles away [82]. For example, the average precipitation in the Amazon can decrease by -62 mm per year (-2.3%) in response to total deforestation [83].
Pulp and paper mills have a significant impact on water through intensive water consumption in the processes of producing the final products. The growing demand for paper products will intensify the pressures on freshwater globally, with some 85% of water use within the industry related to the production processes [84].
In addition, many organic pollutants produced during the paper making process are directly discharged into aquatic systems without proper treatment. The wastewater impact from paper mills has been linked to impacts in fish, including reproductive issues. Toxic pulp and paper effluent also contribute to eutrophication, oxygen depletion, and contaminated water supplies.
Geographical hotspots
Damaging freshwater impacts from the Paper and Forest Products industry take place predominantly in countries with large forestry industries, including North America, Asia, and Europe. The industry is intensifying water consumption in many large paper producing countries, including China, U.S., and Japan [80]. The paper industry in North America consumes more water than many other paper-producing regions in the world. U.S. paper mills use approximately four to 10 times the water volume than those in China and Germany. Even mills with recycled water systems in the U.S. use significantly more water than identical mills in the Europe or China [85].
The growing demand for paper products will also increase the need for wood materials, which will accelerate deforestation, impacting the hydrology in surrounding regions. The evidence of these impacts has been widely observed globally: the Amazon Basin, where 17% of rainforest has been destroyed since 1970 for harvesting of wood, among other reasons, is a well-known example. The remaining natural forests and their associated ecosystems in regions such as Borneo and Sumatra, Papua New Guinea, the Russian Far East, southern Chile, and the Atlantic Forest region in Brazil are at a high level of deforestation risk due to the growing demand for pulpwood [86]. Significant and moderate decreases in precipitation due to deforestation, as a result of wood harvesting and other activities, will likely happen in Northern Hemisphere monsoon regions (East Asia, North America, North Africa, and South Asia) and in the Southern Hemisphere monsoon regions (South Africa, South America, and Australia) [83].
6. Information Technology Sector
The Information Technology Sector (IT) refers to technological products and industries including the High-tech and Electronics, Semiconductors and Circuit Boards, and Battery industries. Semiconductor manufacturing and raw material extraction for batteries are water intensive processes, while electronic waste (e-waste) and battery recycling facilities leach contaminants into water bodies, such as PFAS, nanomaterials, ionic liquids, and metals.
Although the High-tech and Electronics, Semiconductors and Circuit Boards and the Battery industries were not flagged as having a “very high” impact based on the literature review, the emerging impacts from these industries should be further investigated, given the growing global demand for electronic devices and electric vehicles (EVs) and the potential for severe freshwater impacts. For instance, the Battery industry was designated as “high impact” for its direct operations, supply chain, and the product end use cycle, demonstrating that the impacts are consistently high throughout all stages of the value chain. For the Hightech and Electronics industry, both the water quality and water quantity impacts in supply chain and direct operations were high. The water –related impacts of these industries have drawn public attention more recently, so many aspects of freshwater and ecosystem impacts remain to be investigated in-depth.
High-tech and Electronics
The High-tech and Electronics industry is the aggregation of electronics industries using leading-edge technologies to integrate electronic devices and software and provide IT services. The industry also includes the electronic components, equipment, and data centers subindustries.
Figure 16. Summary of High-tech and Electronics industry freshwater impacts along its value chain. Selected hotspots are the regions frequently cited in the literature.
Practices and associated externalities
Highly reactive and toxic rare earth elements (REEs), such as europium and cerium, that are critical industry inputs are released into water bodies without proper treatment through multiple pathways throughout the value chain, including during material extraction. REEs are used to produce electronics products, such as display screens, optical fibers, medical imaging, and magnets. The often ineffective wastewater treatment processes used in factories make these elements a main source of pollution from product manufacturing [87].
Data centers consume water through both direct and indirect pathways. Water is used directly in some data centers for cooling servers and other equipment, while it is indirectly used through electricity (thermoelectric power) generation needed to run the data centers. In 2014, a total of 626 billion liters of water was used by U.S. data centers [88]. A medium-sized data center (15 megawatts) can use as much water annually as three average-sized hospitals or more than two 18-hole golf courses. In the U.S., efforts have been made since 2017 to use more non-potable sources of water, and potable water consumption has dropped from 64% in 2017 to 57% in 2019. Many data center operators in other parts of the world, however, are still drawing more than 50% of their water from potable sources [88].
E-waste is having increasing impacts on water sources globally, with pollutants leaching into water bodies, especially within the countries where tech products are bought and disposed of and those that receive e-waste through transportation and trading. About 8% of used electronic equipment was exported from North American countries in 2010 and 2011, while the total global flow of used equipment was 7% to 20% [89]. Globally, the e-waste generated by the High-tech and Electronics industry contributes 8% of total municipal solid waste. E-waste has been found to leach “forever chemicals,” including perfluorobutane sulfonic acid (PFBS), perfluorooctane sulfonate (PFOS), perfluorooctanoic acid (PFOA), perfluoroalkyl and polyfluoroalkyl substances (PFAS), and metals from landfills. Toxic metals released include chromium, lead, mercury, iron, zinc, copper, and cadmium. Given the growing demand for electronics, the annual quantity of e-waste is expected to increase to 81.57 million tons by 2030 from 59.52 million tons in 2019 [89].
Freshwater impacts
Wastewater released from manufacturing processes used by the High-tech and Electronics industry may include REEs, heavy metals, and organic chemicals, which are persistent and toxic, and, if ingested, can cause severe human health impacts, including nephrogenic systemic fibrosis, neurological disorders, and cytotoxicity.
Pollution from the industrial manufacturing process has triggered water disputes and conflicts between companies and local communities, as evidenced in the Siaoli River basin of Taiwan. In 2001, as several large-scale electronics facilities ramped up operations near the head of the Siaoli River, they began discharging approximately 40,000 tons of wastewater daily into the river, creating a toxic environment that led to fish kills and the closure of fisheries [90]. In 2011, Meiko Eletronics, Apple’s key supplier in China, was identified as having failed to address severe water pollution caused by its manufacturing activities. The report of pollution caused a year-long dispute over water security between the company and local residents [91]. Many other conflicts over water between companies within this industry and local community have been reported globally, including a cross-sector conflict between Samsung Electronics and the utilities sector in Gihueng City in South Korea [92].
While high-tech products have generated direct impacts on surface water, e-waste is one of the major sources of groundwater contamination due to leaching from landfills. Approximately 70% of heavy metals in U.S. landfills come from e-waste, and these contaminants can migrate into both surface water and aquifers through run-off and leaching [93]. The resulting water pollution can have toxic impacts on aquatic species, including fish, and drinking water sources for residents. If these heavy metal residues are not mitigated, many human health issues arise, including hypothyroidism, cardiovascular disorders, and cancer.
Water use by the electronics industry, including data centers, accelerates freshwater scarcity in water-stressed regions and can cause water competition with other local water users. Many data centers in the U.S. draw water from moderately to highly stressed watersheds, leading to conflicts with local communities, such as when conservation groups in South Carolina opposed Google’s data center expansion plans that included withdrawing 5.68 million liters daily from the strained Charleston Aquifer [94]. As the global demand for internet and IT services increases, data centers are being built around the world to provide millions of servers to match the growing demand, so freshwater impacts are likely to accelerate as well.
Geographical hotspots
REEs from industrial wastewater have been most widely detected in the Northern Hemisphere and are starting to emerge in monitoring data in the Southern Hemisphere. China, the U.S., and India generate the most e-waste globally, accounting for approximately 38%. The Global South lacks e-waste regulations, which threatens the water quality in these regions in particular. In fact, over 50% of countries do not have regulations or policies in place to measure and monitor e-waste and related pollutants.
Semiconductor and Circuit Board
The Semiconductor and Circuit Board industry includes both fabless manufacturers and fabrication manufacturers of semiconductors, and related products, such as memory chips, sensors, and processors. Semiconductor production for fabrication manufacturers requires large volumes of water and releases toxic and persistent pollutants, including PFAS and metals.
Figure 17. Summary of Semiconductor and Circuit Board industry freshwater impacts along its value chain. Selected hotspots are the regions frequently cited in the literature.
Practices and associated externalities
Semiconductor and circuit board chip production are extremely water-intensive and require ultrapure water (water that is thousands of times purer than drinking water). Most of the water footprint in the semiconductor industry is from ultrapure water used in manufacturing at fabrication facilities. Other water uses include for cooling systems [95]. The average semiconductor factory uses up to 15 million liters of water per day, consuming more than 1,000 billion liters of water annually. Growing chip sales (a year-to-year increase over 12% from 2016-2018) are predicted to increase absolute water use [96]. For example, water use for chip manufacturing by TSMC in Taiwan, the biggest chip manufacturer in the world, increased fivefold from 43.4 million liters in 2009 to 197.9 million liters in 2019 [97].
Wastewater from the production of semiconductors includes a wide range of chemicals, including perfluorinated chemicals (PFCs) (e.g., perfluoroalkyl carboxylates-PFCAs and perfluoroalkyl sulfonates-PFASs). Wastewater from semiconductor and circuit board production also generates toxic metal pollutants, including barium, copper, manganese, and chromium.
Freshwater impacts
Semiconductor and chip manufacturing can add to water stress and conflict in water- scarce regions. Growing chip sales are expected to increase further demands on available water resources, as approximately 13% of semiconductor production is located in high water-stressed regions [96]. The demand for chips is increasing dramatically and, as a result, the absolute water use from the industry is predicted to increase globally. According to recent data, chip sales grew 29.7% between August 2020 and August 2021, driven by the build out of cloud computing and 5G wireless, along with the growing demand for products using chips, from cars to appliances [98].
Semiconductor fabrication can generate a wide range of toxic chemicals, including metals that have long been detected in water bodies, while some others are emerging in the monitoring data and require further investigation, such as PFCAs and PFAS. Metal contaminants can be toxic to aquatic ecosystems and humans who ingest contaminated water or fish containing the contaminants. PFAS, which are long-lived contaminants, can result in toxic pollution in water bodies and threaten human health for decades after their introduction into the environment.
Geographical hotspots
Semiconductors are manufactured in the U.S., South Korea, Japan, Taiwan, and mainland China, which combined account for more than 80% of the semiconductor manufacturing capacity of the world and the bulk of the industry’s water use. High levels of pollution have been detected in water bodies surrounding many semiconductor manufacturing facilities, particularly in eastern China, Taiwan, and South Korea. There have also been noted environmental violations levied by the local regulating agency in some of these areas due to their polluted discharges.
Battery (Technology Hardware and Equipment)
While the Battery industry is not technically a GICS “industry” (it is included within the Technology Hardware and Equipment industry), the value chain of batteries contributes significantly to freshwater impacts and is included as a separate industry in this assessment. Batteries play a key role in the Information Technology sector and are an important component of the Automobile industry for its electric vehicle (EV) production. The industry’s primary products include lead-acid, lithium-ion (Li-ion), nickel-metal hydride, nickel-cadmium, and nickel-zinc batteries. Among all battery types, investment in Li-ion battery is growing the most, driven by demand for electric cars and the lower cost of Li-ion battery production. In general, the Li-ion battery is more environmentally friendly than traditional batteries, such as lead-acid batteries, because it contains fewer toxic metals. Many of the metals it does contain, including iron and cobalt, are considered safe for landfills [99]. In 2016, Li-ion batteries made up 70% of the rechargeable battery market [100]. The global Li-ion battery market is projected to grow from $41.1 billion in 2021 to $116.6 billion in 2030 [101].
Figure 18. Summary of Battery industry freshwater impacts along its value chain. Selected hotspots are the regions frequently cited in the literature.
Practices and associated externalities
Throughout the value chain, Li-ion battery- powered electric vehicles use less energy than fossil fuel powered vehicles, but they consume 56% more water than other types of batteries to produce [100]. The raw material extraction of lithium and copper mining is extremely water intensive. Wastewater produced during the manufacturing of batteries may include emerging contaminants, including nanomaterials, ionic liquids, metals, and metal oxide nanomaterials. Metals such as lead, arsenic, and cadmium are major pollutants due to leaching at battery recycling sites.
Freshwater impacts
The Battery industry impacts water resources through its raw material sourcing and manufacturing processes, as well as end-of-life battery recycling. Lithium mining for batteries is water intensive and can contribute to freshwater scarcity in lithium producing countries. For instance, in Chile’s Salar de Atacama, lithium and related mining activities consume 65% of the region’s water, leading to groundwater depletion.
Metal leaching from battery recycling sites has severe impacts on freshwater resources and on human health since it can increase toxicity in receiving water bodies and aquatic ecosystems and decrease the quality of drinking water. Ingestion of lead causes a variety of health-related effects, particularly in children, including neurotoxicity, developmental delays, hypertension, impaired hearing acuity, impaired hemoglobin synthesis, and male reproductive impairment. Emerging contaminants in wastewater from battery production, such as nanomaterials and PFAS, can impact soils by damaging their microbial diversity [102].
Geographical hotspots
Hotspots for lithium mining water use include Chile and China. Battery recycling and related freshwater impacts mostly occur in Southeast Asia, Africa, and Central and South America, putting almost 1 million people at high risk of lead pollution [103].
7. Utilities Sector
The Utilities sector includes industries that produce or distribute electricity, gas, and water to customers. Key industries within the sector identified as causing significant impacts to freshwater resources include Electric Utilities and Renewable Electricity. Among those, Renewable Electricity—specifically, hydropower— was identified as having the most severe and systemic impacts. The Electric Utilities industry is included in Appendix E.
Renewable Electricity
The Renewable Electricity industry generates electrical power using renewable energy sources, which include hydropower, wind power, solar, and geothermal systems. According to the International Energy Agency [104], the share of renewable energy as part of global electricity generation grew from 27% in 2017 to 29% in 2020, with hydroelectric power accounting for much of that generation. Renewable electricity generation in 2021 is set to expand by more than 8% to reach 8,300 TWh, the fastest year-on-year growth since the 1970s, with solar photovoltaic and wind contributing two-thirds of this growth. Electricity generation from wind is expected to notch the largest increase among renewables, growing by 275 TWh, or almost 17%, significantly greater than 2020 levels [105].
Figure 19. Summary of the Renewable Electricity industry impacts freshwater resources along its value chain. Selected hotspots are the regions frequently cited in the literature.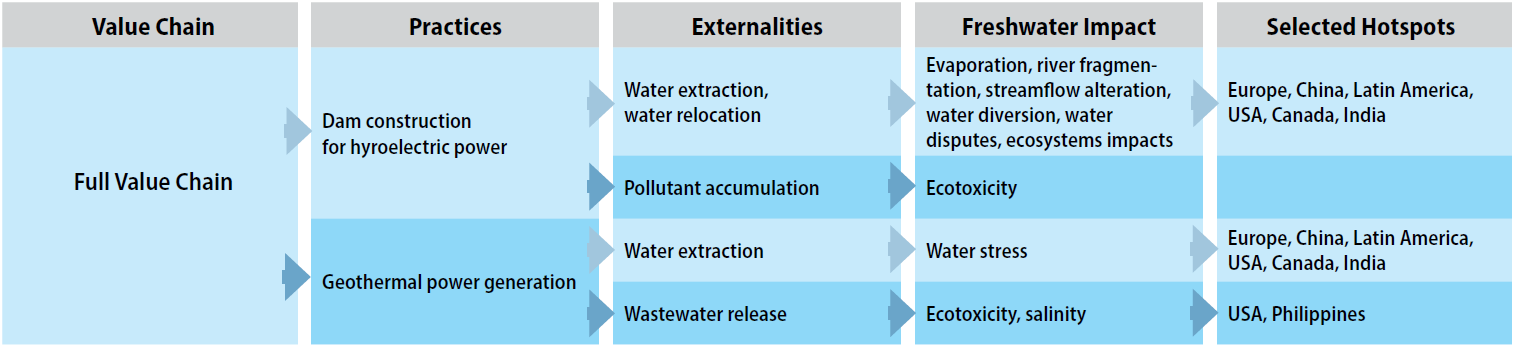
Practices and associated externalities
The Renewable Electricity industry uses significant amounts of water to produce electricity, the vast majority for hydropower plants. Hydropower plants use flowing water from surface water bodies to generate power before discharging the water in a different location. Their construction and operation can severely alter the temporal patterns of the natural streamflow of rivers and, as a result, natural habitats. From 2008-2012, the global consumptive water footprint of electricity and heat was estimated to be 378 billion m3 per year, with hydropower making up 49%. Geothermal, solar, and wind energy contribute very little to the global total consumptive water footprint, at just 0.06% [105].
Hydropower plants are the primary driver of streamflow alteration, water diversion, and river fragmentation. Globally, dam construction for hydropower is one of the main drivers of river fragmentation. Only 37% of the world’s long rivers are still free flowing, with 23% flowing uninterrupted into the ocean [106].
Dam construction also impairs water quality, particularly through the release of heavy metals. In China’s Manwan Reservoir, high heavy metal concentrations were observed in river sediment for seven years after the dam closed. Dams also collect contaminants, such as nutrients and sewage, which are often eventually released downriver.
Geothermal power plants have a fairly small water footprint. However, they release large quantities of waste heat relative to other types of power facilities, as well as geofluids. Water impacts from waste heat and geofluids include thermal pollution and the release of salts and metals into water bodies, such as hydrogen sulfide, boron, ammonia, mercury, and arsenic. The release of geofluids from the cooling systems of these plants can be highly saline, as evidenced in the Salton Sea field in the U.S. and in Iceland [107].
Freshwater impacts
Water is withdrawn from lakes and rivers as a free resource by thermal and hydropower plants. During droughts, however, obtaining water can become a financial burden on power companies. In 2021, a California hydropower plant on Lake Oroville shut down for the first time since it opened in 1967 due to low reservoir levels. Dams and reservoirs also lose large amounts of water to evaporation, especially in hotter climates [108],[109].
Hydro-related streamflow alteration and river fragmentation also affect the magnitude and seasonality of flows, floodplains, riparian and aquatic habitat, sediment transport, and fisheries. River fragmentation has been linked to sharp declines of terrestrial and aquatic species, contributing to the 83% decrease in freshwater populations since 1970 [110]. Streamflow alteration is reported to have higher impacts on river systems than water consumption. Hydroelectric power dams also create socioeconomic impacts and water conflicts. It is estimated that up to 80 million people have been displaced because of dam construction over the past 100 years [111]. On the other hand, the expansion of renewable energy, particularly solar and wind, can have a positive effect on reducing system-level water consumption because it displaces water-intensive fossil fuel generation.
Geographical hotspots
China, the U.S., Canada, and India, along with some countries in Europe and Latin America, rely on large amounts of freshwater for renewable electricity, specifically hydropower. The construction and operation of hydropower plants have altered streamflow in most of the world’s rivers, and many large river basins have been heavily fragmented, except for those in remote areas, including the Arctic, the Amazon Basin, and the Congo Basin [105].