The evaluation of the scientific evidence identified in Chapter 2 reveals the enormous water impacts of industrial sectors and their widespread systemic effects along industrial supply chains. In this chapter, critical and emerging freshwater impacts and threats that have been identified to be systemic in nature are discussed, along with resulting potential risks to industries. Systemic water impacts affect interrelated systems in pervasive ways and can be identified as ones that [112]:
- Jeopardize water quantity to the point that available water is insufficient to meet objectives over a specific period.
- Impact water quality so that the water is no longer adequate for a particular purpose.
- Create extreme conditions, including droughts and flooding, that lead to too little or too much water, preventing objectives from being met and imposing additional costs.
- Impede effective functioning of freshwater ecosystems, reducing environmental services for society and the environment.
Critical Threats
From the collection of scientific evidence, we identified five critical systemic threats: (1) eutrophication, (2) groundwater depletion, (3) diversion and transfer of water, (4) metals contamination, and (5) plastic pollution. As gleaned from the literature, these critical threats are:
- Causing systemic water impacts due to alteration of water quantity, water quality, and the broader physical environment.
- Attributable to practices, activities, and impacts associated with multiple sectors, industries, and their extended value chains.
- Geographically distributed, which create vulnerable hotspots globally.
- Producing chronic impacts that are larger in scale and over longer duration producing ever-deepening impacts.
Five critical and systemic threats identified
Figure 20. Chart of critical threats as identified through the literature review.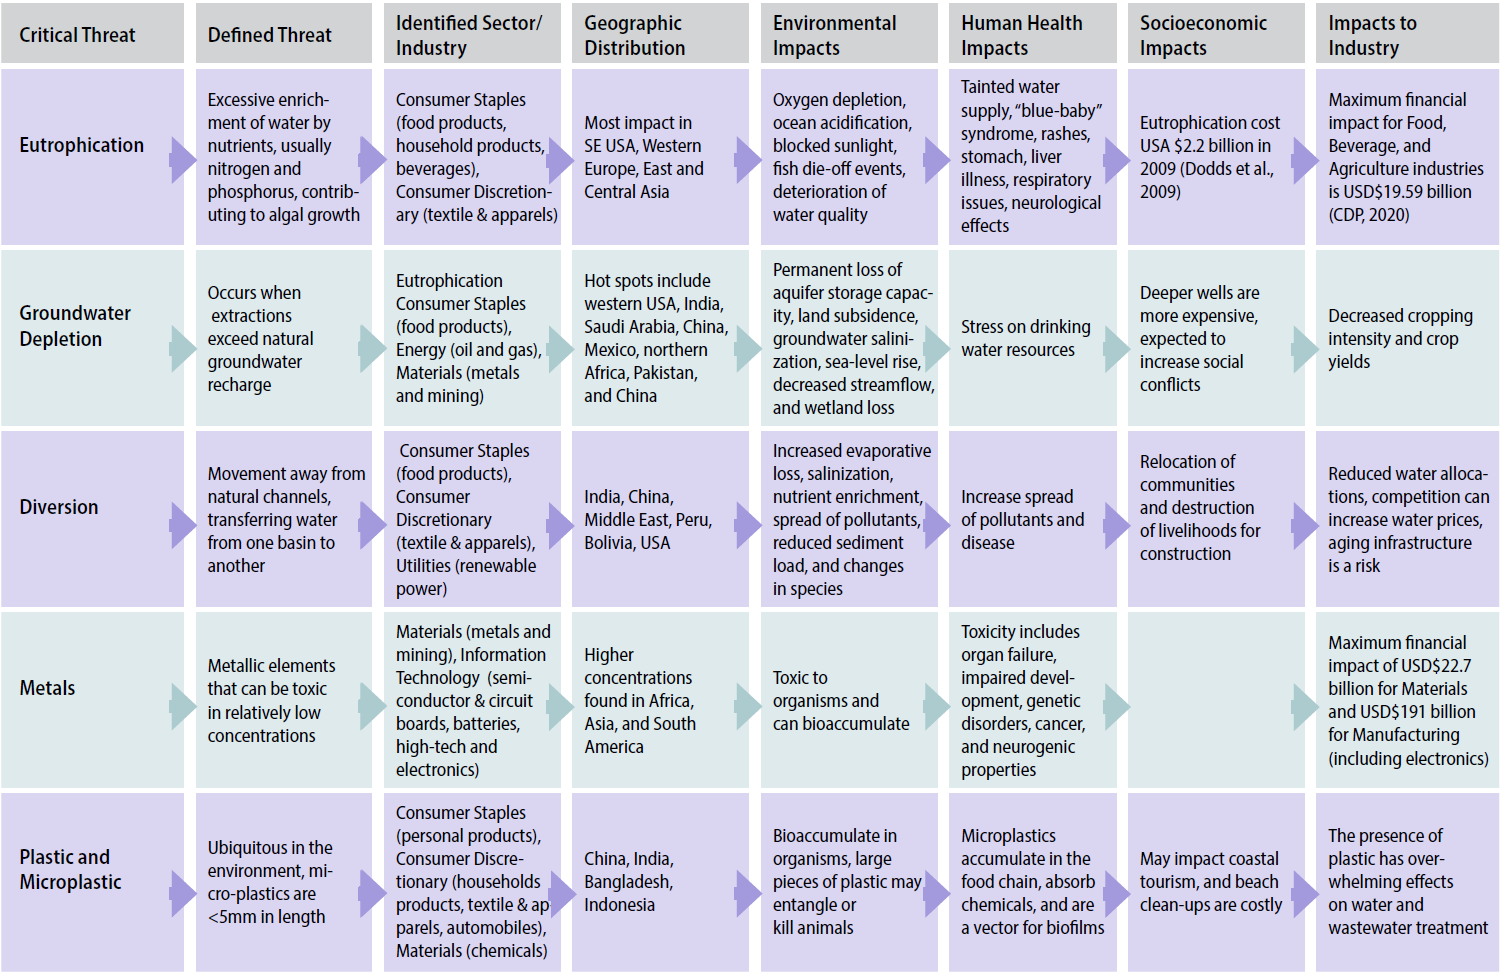
1. Eutrophication
Eutrophication is a complex process that results from excessive nutrient loading of water, usually nitrogen and phosphorus, which in turn stimulates excessive growth of algae and other aquatic plants that consume oxygen in the water. Eutrophication is strongly linked to oxygen depleted water known as hypoxic and anoxic “dead zones,” which can cause catastrophic system stressors, such as fish die-off events, blocked sunlight, declining water quality, contaminated water supplies, and ocean acidification. The increasing concentration of nitrogen and phosphorus in the world’s water systems is broadly recognized as one of the most pressing threats to global sustainability [26]. In the U.S. alone, the EPA has identified more than 166 dead zones across the country, including in the Great Lakes, the Chesapeake Bay, and the Gulf of Mexico [113].
Industrial practices
The Consumer Staples sector is the largest global source of human-driven nutrient loading, in particular the Food Products industry, which generates enormous amounts of nutrient pollution from livestock production, fertilizer application, and runoff. The estimated global annual nitrogen and phosphorus loss to water from manure and fertilizer use alone is 9.10 million and 1.65 million tons, respectively [114]. Other agricultural industries contributing to nutrient loading are Aquaculture, Food and Meat Processing and Packaging (slaughterhouses and dairy), Beverage, and Textiles (cotton and silk). Activities from these industries that contribute to nutrient loading include onfarm fertilizer use and the release of product manufacturing wastewater.
The Household Products industry, particularly from detergent use and resulting releases into municipal wastewater, is also strongly associated with phosphorus discharges, which have been directly tied to major eutrophication events in freshwater bodies around the world. For example, 24% of phosphorus loadings into the Black Sea were associated with detergent use [115].
Global trends
Globally, 415 coastal areas have been identified as eutrophic, of which 169 are hypoxic (dissolved oxygen concentrations of less than 2-3 mg/L) [26]. Hypoxic and eutrophic zones are prevalent along the coast of western Europe, the eastern and southern coast of the U.S., and around East Asia (Figure 21). In August 2021, the low oxygen ‘dead zone’ in the Gulf of Mexico covered about 6,334 square miles, which is roughly the size of Connecticut. A major contributor to this is nutrient pollution from agricultural activities along the Mississippi River watershed, which drains from the Midwest. Coastal hypoxia related to eutrophication in the U.S. has increased almost 30-fold since 1960 [116].
Eutrophication affects 54% of the lakes and reservoirs in Asia, 53% in Europe, 48% in North America, 41% in South America, and 28% in Africa [118]. Recent satellite data shows that the problem is worsening in many lakes around the world (Figure 22) [119]. Within North America, phosphorus inputs from tributaries into Lake Erie have increased from 11% to 24% since the mid-1990s, creating dangerous algal blooms [120]. Since the late 1980s, approximately 62% of water areas in 67 of China‘s main lakes have become severely eutrophic [121].
Industrial risk
Eutrophication is not only a challenging issue, but also a costly one. In the U.S. alone, damages to freshwater bodies from eutrophication exceeded $2.2 billion in 2009, including the loss of value from reduced recreational usage, impacted waterfront real estate, loss of biodiversity, and impaired drinking water quality [122].
The Consumer Staples sector was identified as the leading global contributor of human-driven nutrient loading, but it is also exposed to water risks associated with eutrophication. For example, eutrophication has forced some countries to implement remediation requirements or strict controls, leading to new expenses for the owners of farms, businesses, or facilities that generate high nutrient loads. In the U.K, one estimate pegs the costs to farmers who adopt new farm practices aimed at reducing nutrients in established nitrate sensitive aquifers at as much as $4.75 million annually [123]. Existing private investment in food and agriculture assets is at high risk from the hidden system costs and risks (costs arising from their impact on health, nutrition, and the natural environment). Mitigation policy costs related to freshwater eutrophication damages in England and Wales were estimated to be as high as $77 million per year, with over $15 million borne by industrial sectors, including tourism [114].
Food-related industries could save more from investing in the transition to less nutrient dependent production than would be spent on such hidden costs in the future [124]. Without large-scale environmental improvements focusing on mitigating water impacts, the Food Products and Beverage industries face overall water-related financial risks of as much as $196 billion, compared to the $11 billion it would cost to reduce water impacts [7],[125].
Global map of eutrophicated ecosystems and coastal hypoxic areas
Figure 21: Map of coastal hypoxic areas due to eutrophication. Human footprint in the figure was estimated based on four types of data that represent human influence on nature: population density, land transformation, accessibility, and electrical power infrastructure. The map shows the global distribution of over 400 ecosystems that have scientifically reported of being eutrophicated and matches the global human footprint [117]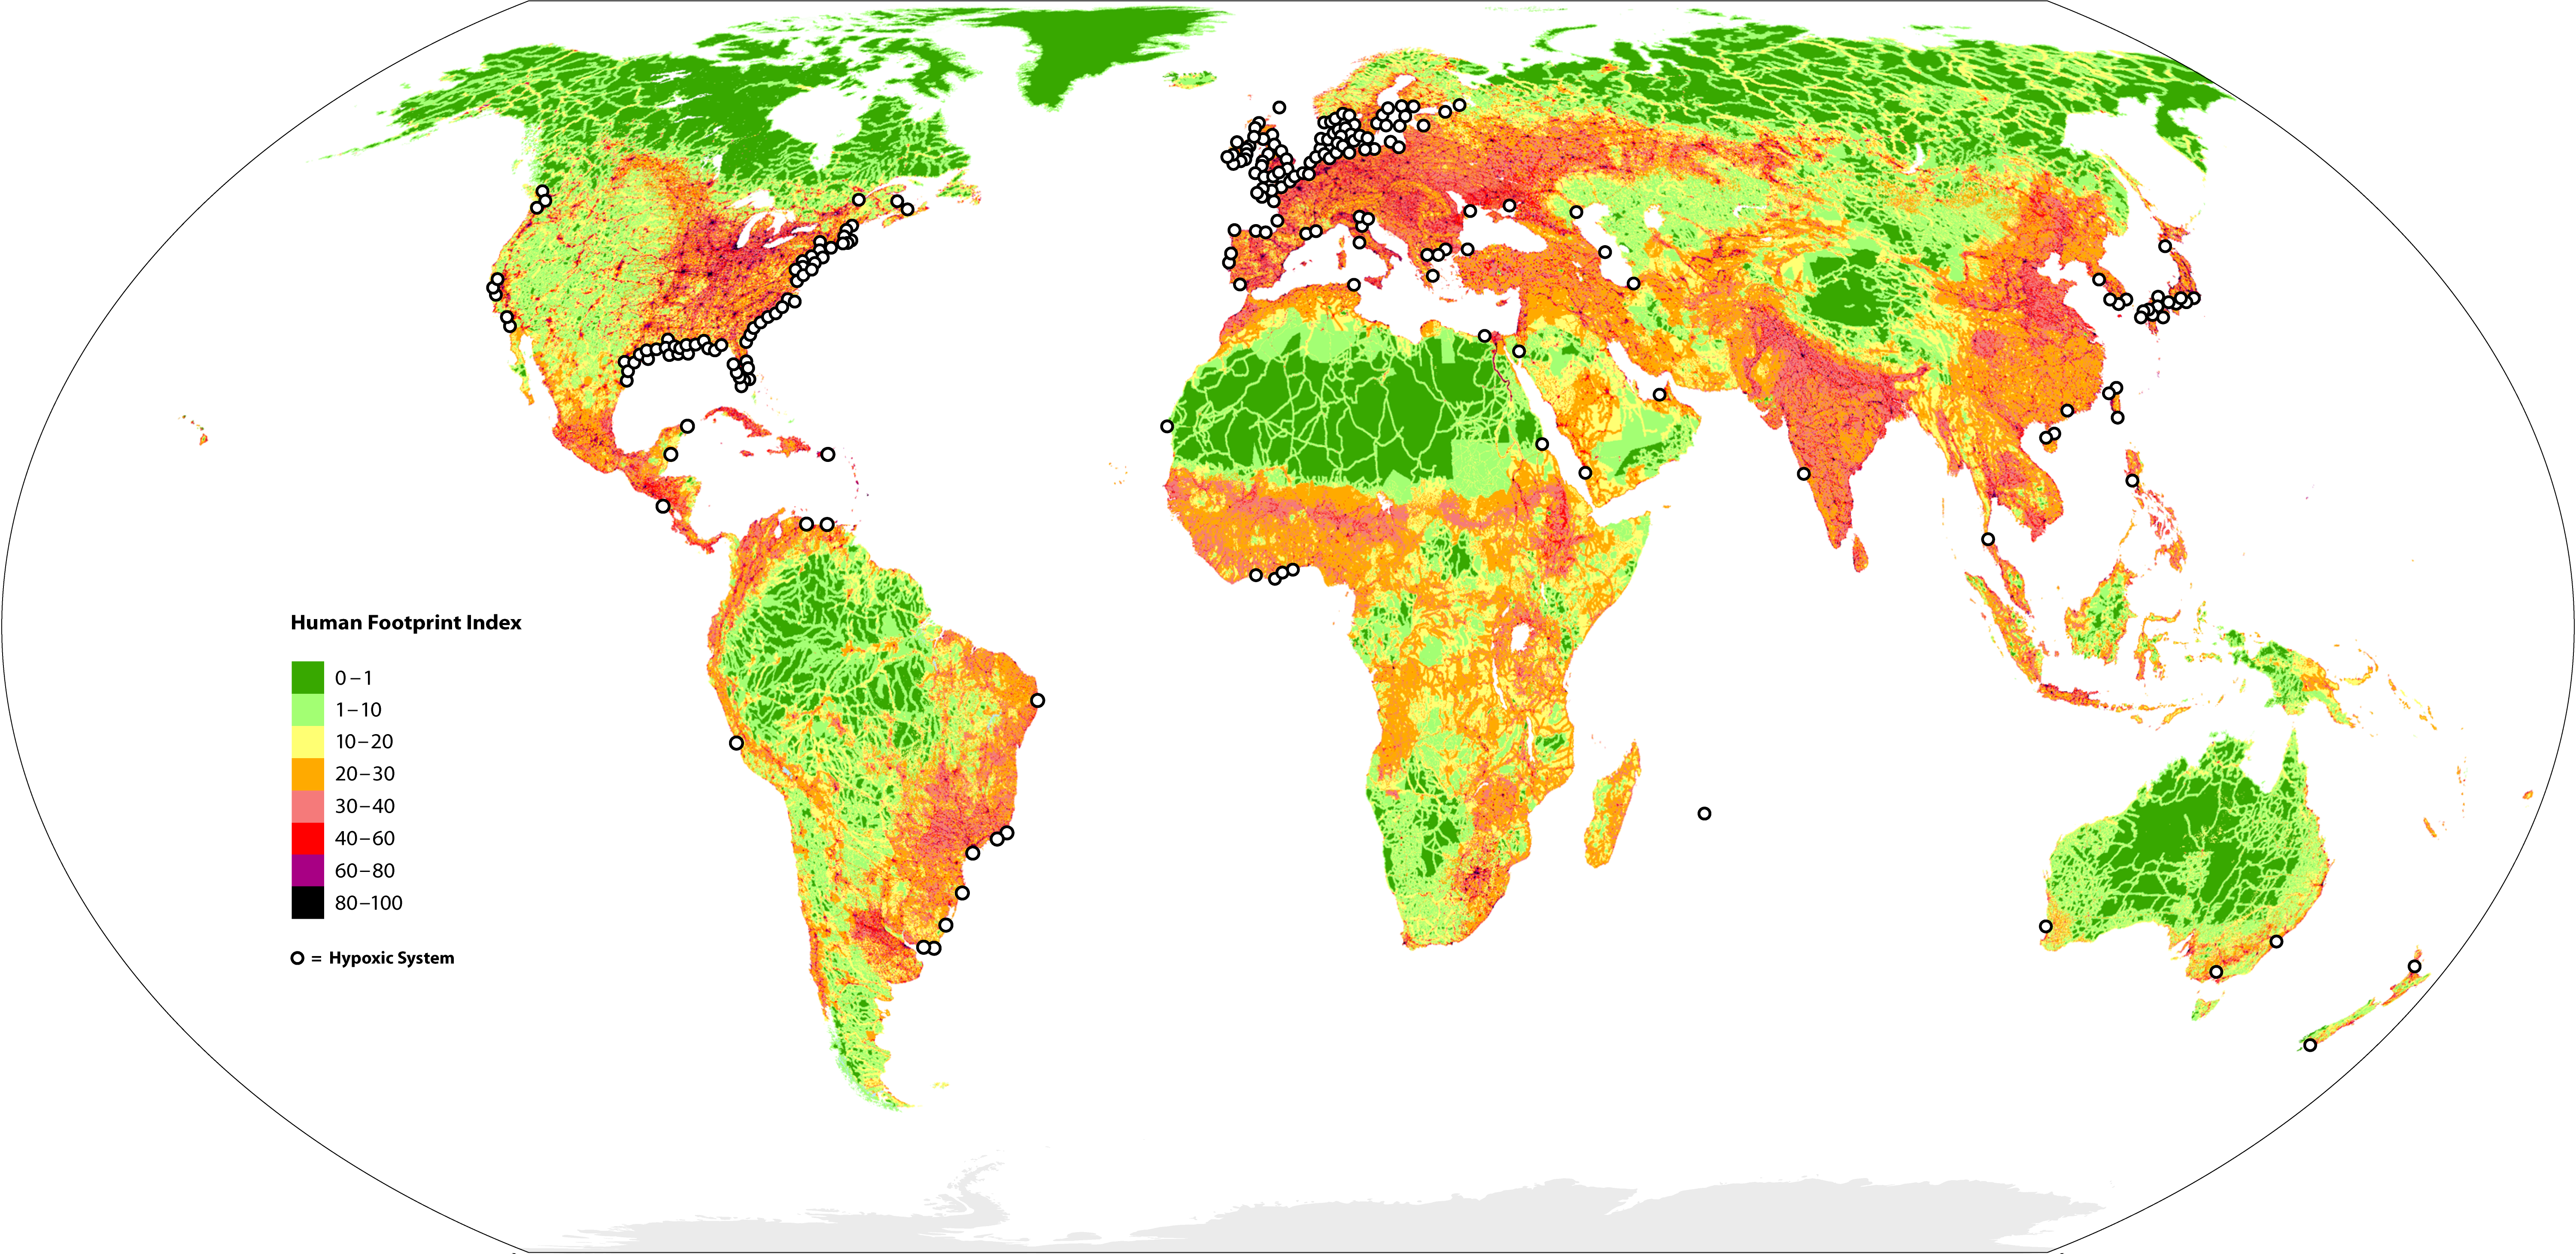
Mitigation
Many countries, including the European Union, Australia, and the U.S., have banned the use of phosphates in detergents. Companies, including Procter & Gamble and Seventh Generation, have removed phosphates from all of their laundry detergents worldwide. Yet, while North America and Europe are enacting policies to limit phosphate use, it is estimated that nutrients in municipal wastewater systems will increase by a factor of 4 to 8 in sub-Saharan Africa, and 3 to 5 in South Asia by 2050 [126].
Practices contributing to nutrient pollution in the Food Products industry, such as agriculture and livestock production, have tended to be less regulated globally. Even as it acknowledges that more than 80,000 miles of rivers and streams are impaired due to nutrient pollution, the EPA has not prioritized combating nonpoint pollution from nutrient runoff and has opted for more voluntary programs. State regulations have also been generally weak, whether for large-scale poultry producers in North Carolina or corn and soybean producers in the Midwest [127]. In recent years, there has been much more scrutiny on the overall practices of the food-producing industry, but the focus on water remains a neglected component [128]. Europe has taken stronger regulatory measures, but challenges persist.
A recent report by the European Commission warned that, even as Europe has taken steps to reduce nitrate pollution over the past 30 years, between 2016 and 2019, 14% of groundwater supplies still exceeded nitrate levels for drinking water, while roughly a third of coastal waters and lakes were eutrophic [129]. The European Green Deal calls for reducing nutrient losses into water bodies by at least 50% by 2030 [130].
Measures that can reduce nutrient pollution include best management tillage practices, improved manure management, increased crop nutrient efficiency, larger buffer strips, constructed or restored wetlands, and improved wastewater treatment plants [131]. While voluntary industry-led initiatives are underway in the U.S. to adopt such practices, these efforts are mostly small-scale in nature. Many smallholder farms in developing countries do not use best management practices, compromising both the environment and crop yields. Nature-based solutions that emphasize natural processes in practices should be prioritized. Implementing such practices can enhance water availability through soil moisture retention and groundwater recharge, improve water quality by maintaining wetlands and building riparian buffers, and reduce risks associated with water disasters through the restoration of ecosystems.
Figure 22. Global distribution of lake bloom intensity trends since the 1980s [119]. P refers to the statistically significant level determined for the study. Lakes that have seen a significant decrease (P<0.1) in bloom intensity are rare (less than 8%).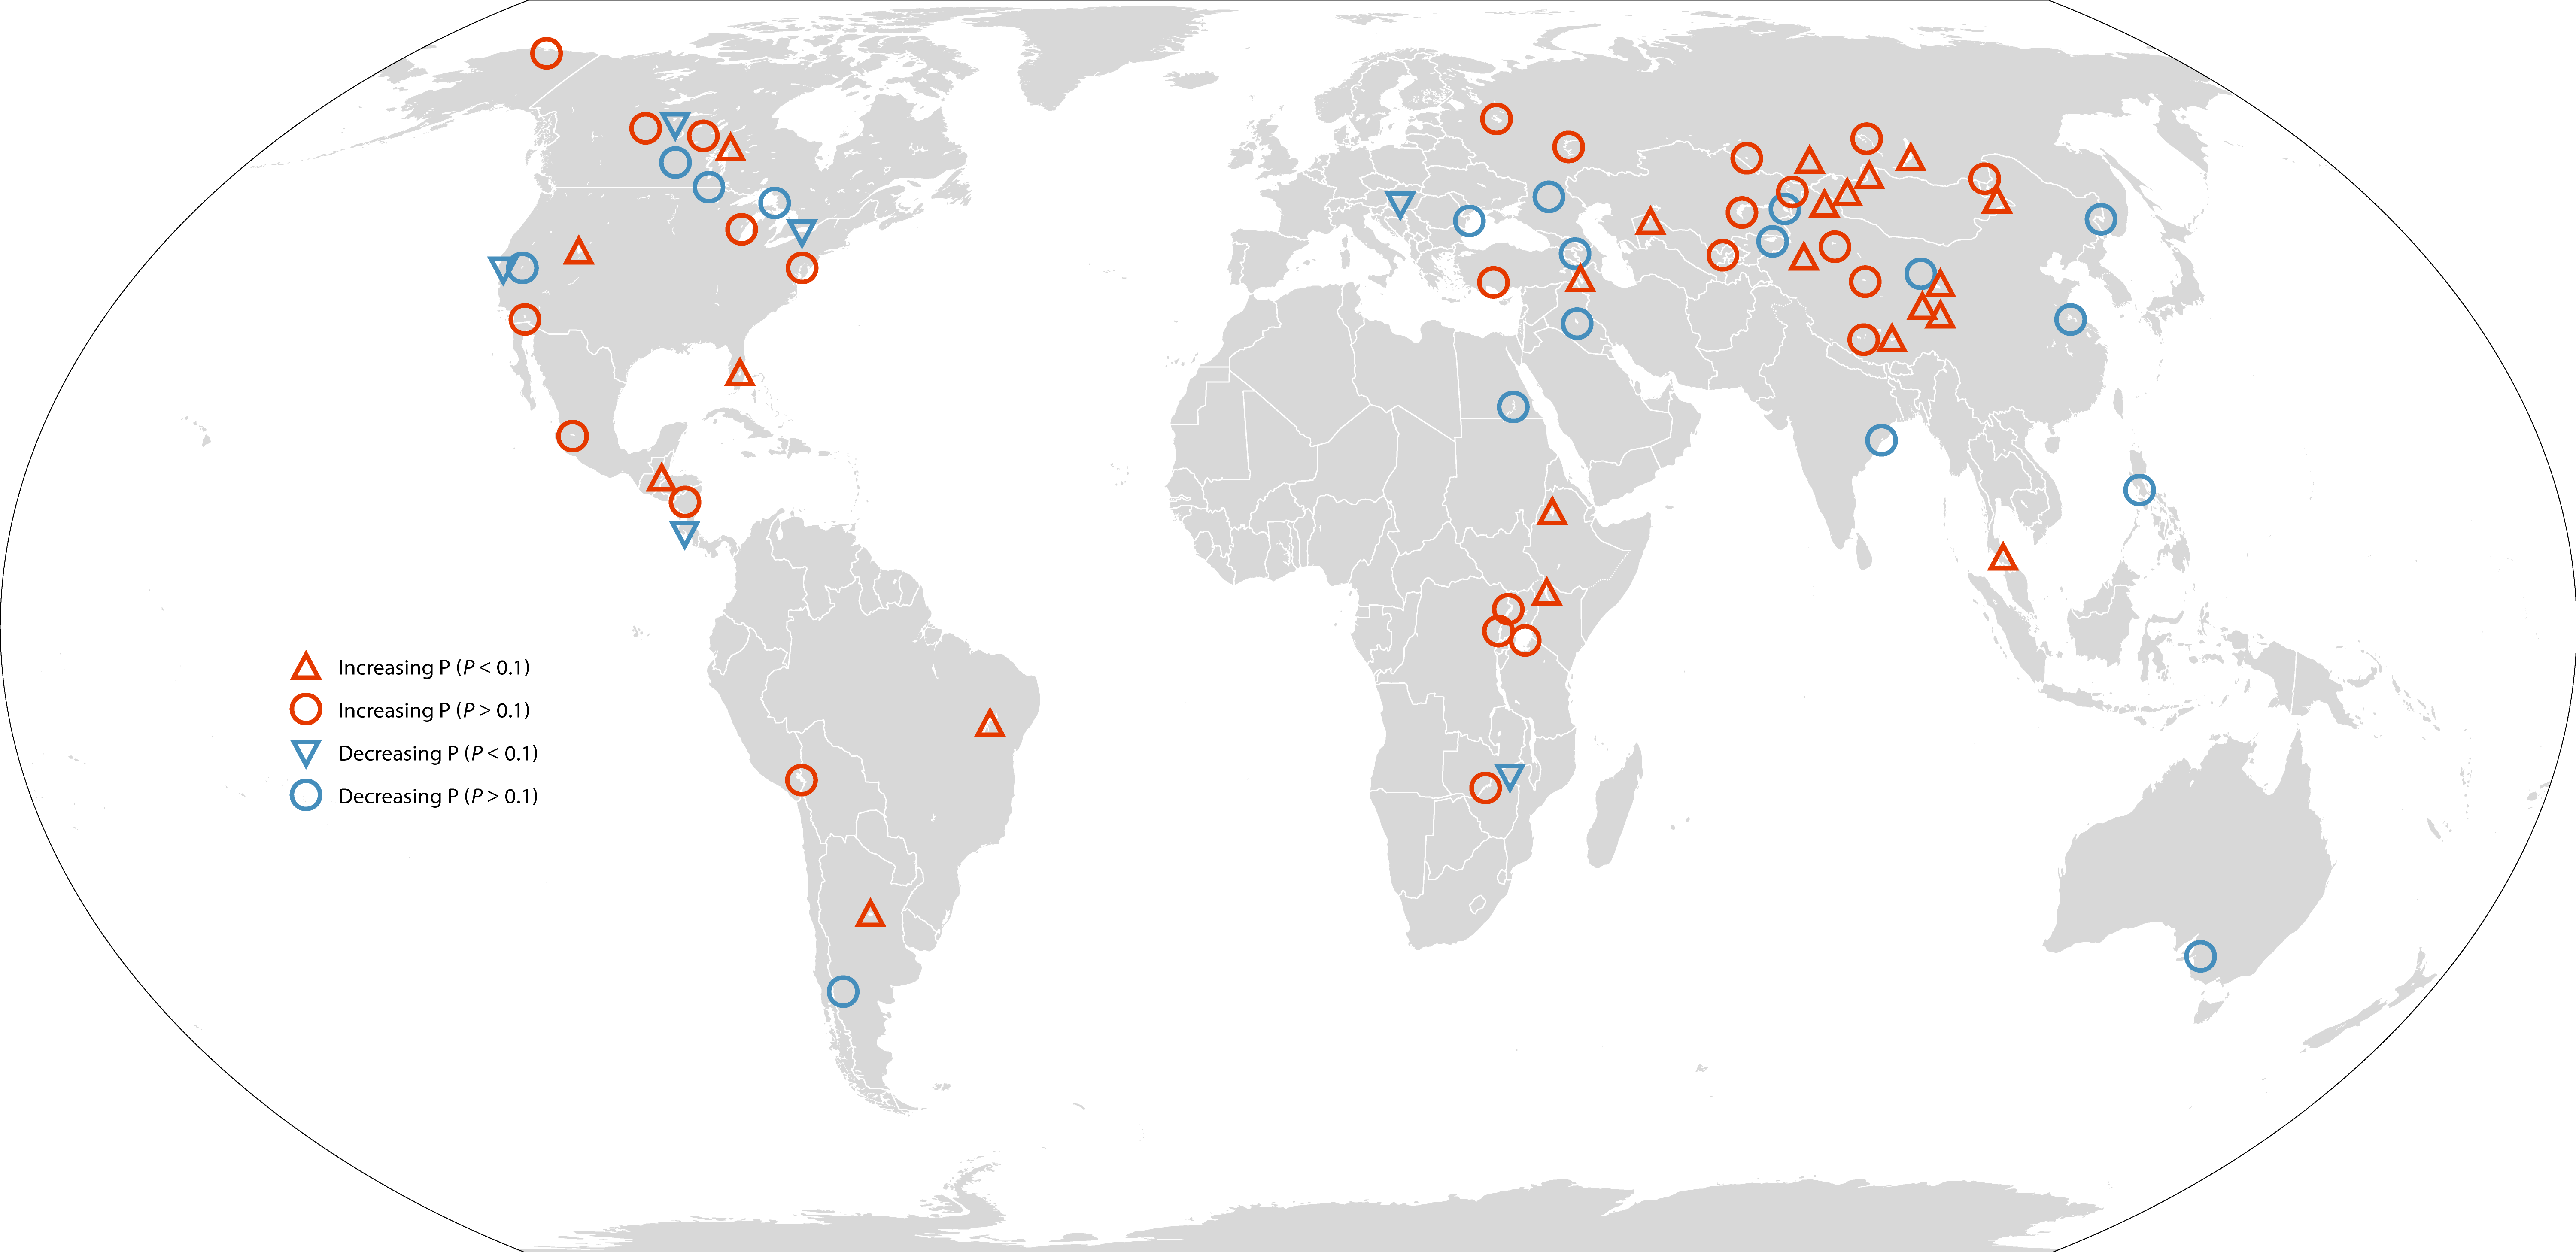
2. Groundwater Depletion
Groundwater depletion is an escalating global threat that has led to groundwater wells drying up due to excessive water extraction that exceeds natural recharge capacity. Left unchecked, the hydrological and socioeconomic impacts of this unsustainable water use will be profound.
Global depletion of groundwater aquifers due to crop production
Figure 23. Crop-specific contribution to groundwater depletion worldwide in 2010. Note: This study simulated crop water use for 26 irrigated crop types, including food crops and cotton. The pie charts show fractions of groundwater depletion (GWD) for irrigation of major crops by country, and their sizes indicate total GWD volume. The background map (in grey) shows the groundwater stress index for major aquifers [132],[133].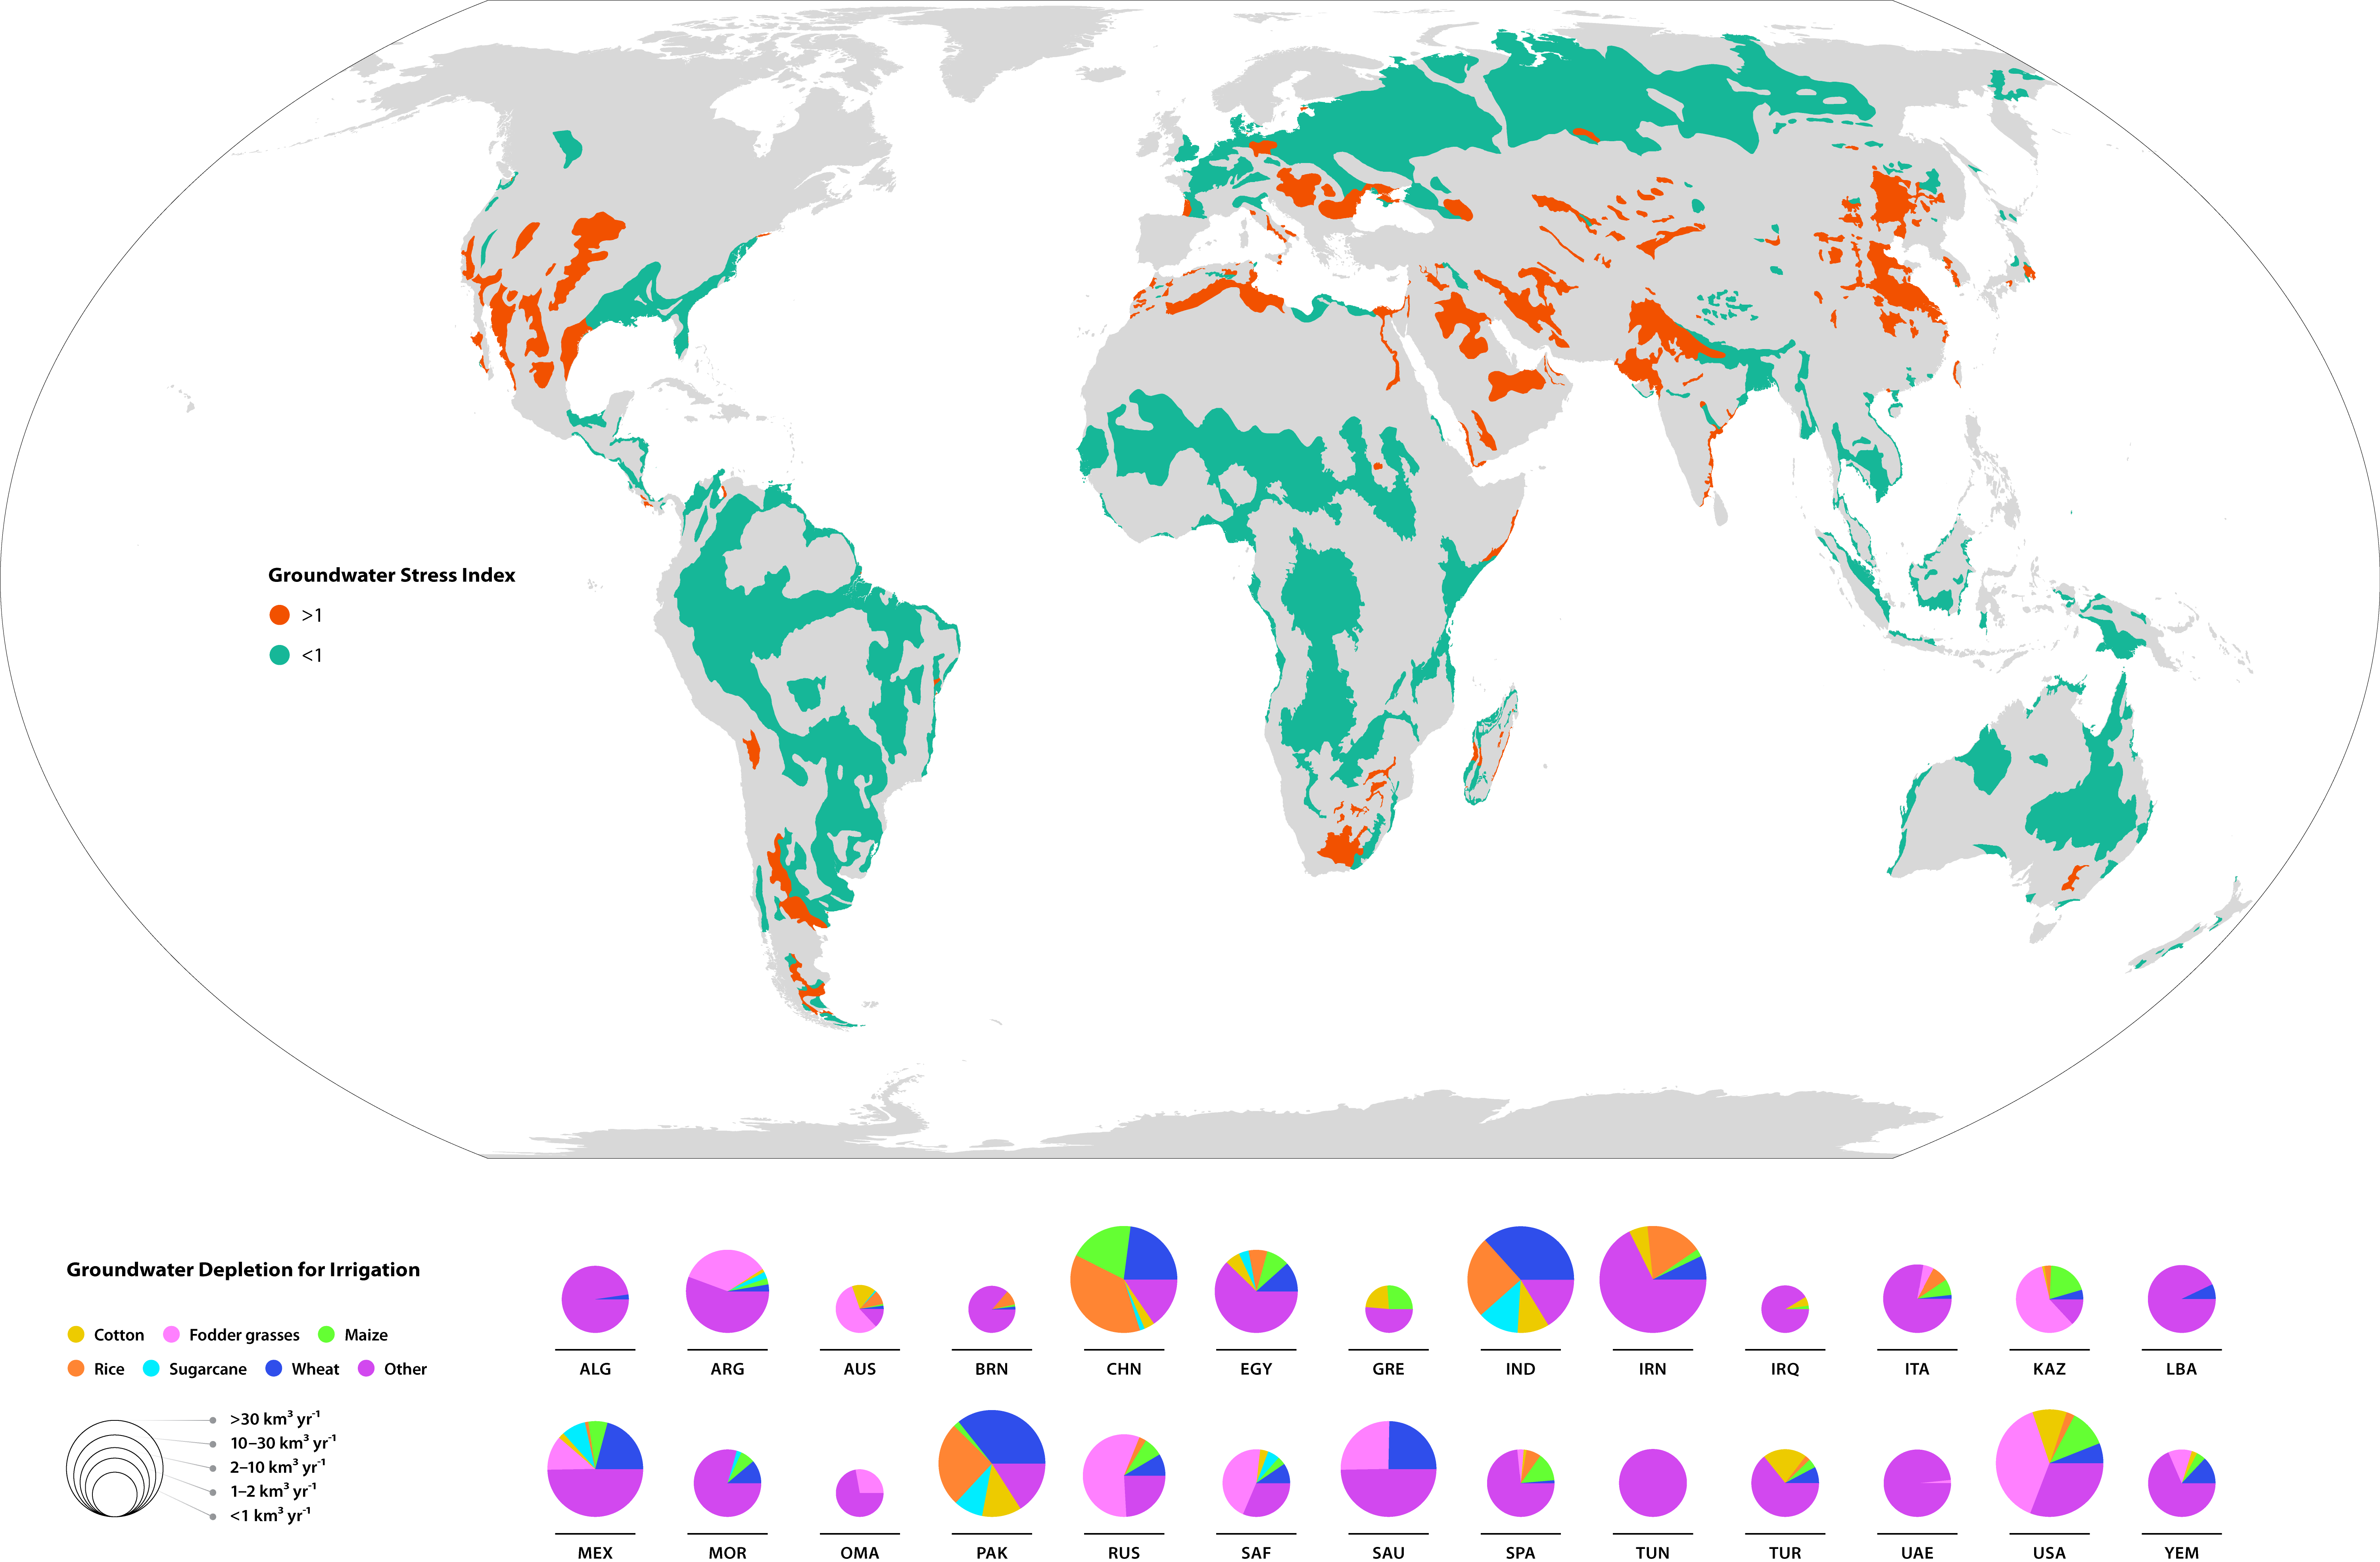
Industrial Practices
The primary activity causing groundwater depletion is irrigation within the Food Products industry. Irrigation is an essential part of farmbased food production at the beginning of the industrial value chain. Global groundwater depletion of aquifers increased by 22% from 2000 to 2010, mostly due to crop-related irrigation (Figure 23). Depletion rates are much higher in countries, such as India, Pakistan, China, and the U.S., that are heavily reliant on groundwater for crop irrigation. Mexico, the Middle East, and North Africa also have high depletion rates due to irrigation. High intensity groundwater depletion caused by crop cultivation is observed in Kuwait, which uses 1,900 liters of water per kilogram of wheat, in Iran, which uses 21,00 liters of per kilogram rice, and Saudi Arabia, which uses 790 liters of water per kilogram of maize. A 2019 study estimated that, without better management, between 42% and 79% of watersheds that pump groundwater globally could pass ecological tipping points by 2050. An example of a watershed at risk is the Ogallala Aquifer, an enormous water source that runs beneath eight states in the U.S. Great Plains [4].
Metals and Mining and Oil and Gas are other major industries that are severely stressing groundwater resources. In addition to overextraction, mining and fossil fuel activities can dramatically alter groundwater systems by physically damaging aquifers. For example, hydraulic fracturing can lower groundwater levels, further increasing erosion and sedimentation and habitat fragmentation and depleting surface waters, as shown by field studies in Michigan [134]. Fracking fluids and methane, as well as volatile organic compounds released by the Oil and Gas industry can contaminate groundwater quality [135].
Global Trends
Groundwater is the primary water source for up to 40% of irrigated lands globally and 60% within the U.S. [136],[137]. It is also intensively used as an additional water source during drought periods. Irrigation by the Food Products industry has been the primary stressor in many arid and semi-arid regions globally, including the Ganges Basin in northern India and the Arabian Aquifer underneath Saudi Arabia and several other Middle East nations. The U.S. (such as California’s Central Valley and the Ogallala Aquifer, which account for up to 50% of the country’s groundwater depletion since 1900), Mexico, North Africa, India, Pakistan, and China also have severe groundwater depletion from crop-related overexploitation [74],[133]. In 2010, wheat production was the biggest cause (22%) of global groundwater depletion, followed by rice (17%), sugar crops (7%), cotton (7%), and maize (5%) [133]. India and Pakistan used the most groundwater, 30% and 11%, respectively, contributing to global groundwater depletion. China and the U.S. used the most groundwater for maize production, 4.7 and 3.0 km3 per year, respectively [133].
The mining industry in northwest Australia has been one of the world’s largest groundwater users, causing severe depletion of the Canning Basin Aquifer. Satellite data has shown that this aquifer had the world’s third highest rate of groundwater depletion, with annual loss rates ranging from -10.74 to -8.06 mm from 2003 to 2013 [74].
Industrial risks
Groundwater levels are dropping in many parts of the world, resulting in higher capital costs and operating costs to pump water, along with other negative economic externalities. Additional costs for Food Products companies, for example, can be declining yields and crop areas that will affect the key inputs to this industry. In northern India, cropping intensity, or the number of crops a farmer can grow in a given year, decreased by 68% due to groundwater depletion [138]. Depletion also caused reduced yields for winter wheat, rice, and maize in India from 2004 to 2013 [139]. Similar trends are underway in California, where devastating droughts and groundwater depletion forced farmers to leave millions of acres unplanted in recent years [140]. Competition between groundwater users is becoming more common as the resource becomes scarcer, potentially leading to conflict and reputational risks for industry.
Mitigation
Among the 38 OECD countries, policy instruments are more commonly used to protect surface water than groundwater, according to a recent OECD report. Only 36% of the countries use policy incentives, such as allocation, taxes, and charges, to recover groundwater supply costs for agricultural food production [141]. Government policies and management practices in some regions where groundwater is being depleted are actually promoting depletion. In Syria and India, energy subsidies have been used to defray groundwater pumping costs and irrigation system expansion. These policies fail to balance short-term agricultural productivity with long-term depletion impacts. In many water-stressed regions, including Spain and Portugal, irrigation systems are being expanded without appropriate water planning and regulation (for example, better soil and canopy management), resulting in inefficient water use and the planting of water- intensive crops, such as orchard trees and wine grapevines [142],[143].
Agricultural food and water policies have been strengthened in many OECD countries over the past dozen years. In the case of groundwater management, licensing schemes and pricing are popular tools for water allocation systems and groundwater use. In Australia, most states’ groundwater rights have been separated to the extent that water can be traded between properties using the same aquifer. In Belgium, every groundwater extraction site has been required to use a water flow meter for agriculture and horticulture irrigation since 2010. California’s Sustainable Groundwater Management Act, approved in 2014 and taking effect in 2022, is designed to limit water users’ (including farmers’) access to water in accordance with aquifer recharge needs [140],[144].
3. Diversion and Transfer of Water
Large-scale water diversion includes transferring water from one river basin to another and artificially concentrating water in large quantities using man-made channels and reservoirs. These activities fundamentally change the hydrology and critical habitats of river basins
Industrial Practices
Water diversion and transfer projects typically bring water to dry, water-scarce regions, primarily for the Food Products, Renewable Electricity (specifically hydropower plants and consumable fuels) and Metals and Mining industries. Crop irrigation uses pipes, canals, and sprinklers to draw water from natural water sources. This allows farmers to grow crops on a consistent schedule, especially when facing irregular water supplies. But large-scale water transfers can also disrupt natural water flows, causing unequal disparities in water distribution and negative impacts on soil health (e.g., increasing salinity).
The Renewable Electricity industry diverts water to generate hydropower and produce consumable fuels such as biofuels. Energy production accounted for 15% of all global water withdrawals in 2010. By 2035, it is expected to be 20% [145]. Nearly a fifth of all the power generated in California is for water-related uses, particularly to pump and transport water hundreds of miles to farmers in arid southern California.
Water diversion projects, both from their construction and operational activities, impact rivers and lakes across the world. Dams and reservoirs can have high levels of evaporative losses and leakage if they are not well maintained. They can cause salinization, sedimentation, and nutrient enrichment in dams, reservoirs, and watersheds due to water regulation processes. Regulation processes alter water flow conditions, which can further accelerate eutrophication and disrupt aquatic habitats. This can promote the transmission of waterborne disease, as has occurred in many dammed rivers, such as the Mekong River in South Asia and the Volta River in Ghana [146],[147]. Diversion projects can also lead to negative socioeconomic ripples, including human relocation, destruction of livelihoods, and increased probability of conflicts between users. Among the most glaring examples is China’s Three Gorges Dam, which forced between 1.1 and 1.6 million residents along the Yangtze River to relocate [148].
Table 3. Future water transfer megaprojects (either under construction or planned) in the world [150].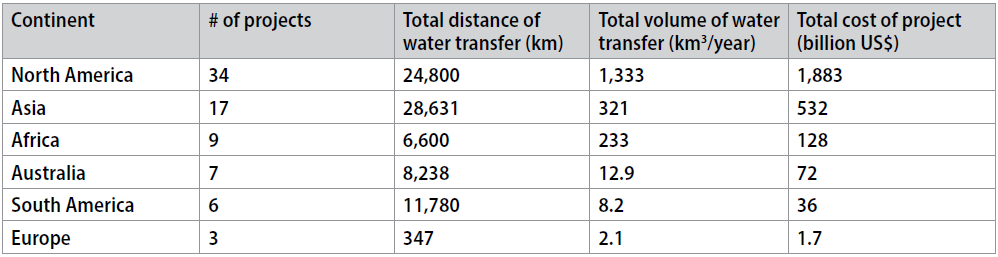
Global Trends
Natural water systems are being disrupted by large-scale water diversion projects globally. Between 1985 and 2017, the number of inter- basin water transfer projects (man-made transfers of water that cross basin boundaries) grew eightfold in the U.S., from 256 to 2,161. Dams built for food product-related irrigation are centered mostly in Asia (India, China, Middle East) and South America (Peru, Bolivia). Asia’s dams also provide hydroelectricity. Dams in North America were built primarily for flood control, hydroelectricity, irrigation, and recreation [149].
Globally, there are 34 existing water transfer megaprojects (defined as those with construction costs over $1 billion, transfer distance over 190 kilometers, or volume transfers exceeding 0.23 km3 each year). As seen in Table 3, a total of 76 projects are under construction or in planning phases, most of them for agriculture development (19 in North America, eight in Asia, and Africa, three in Australia and South America, and one in Europe). Another 13 are for hydropower generation (seven in North America, three in Africa, two in Asia, and one in Europe) and seven for the mining industry (one in Africa, two in Asia, two in Australia, and two in South America [150].
Water diversion and transfer projects impact both the contributing and receiving regions through streamflow alteration and fragmentation. Over 48% of global river basins are severely affected by water diversion projects, especially in North America and Asia. Figure 24 shows that a total of 407 global basins (21% of global river volume) are severely affected by both flow regulation and fragmentation (green colors), especially in basins with a long history of dam building, such as the Nile and Mississippi [151]. Withdrawals from China’s Yellow River have decreased annual streamflow by 10% compared to historical averages. Global river fragmentation will likely double if the nearly 4,000 planned hydroelectric dams are built globally [151]. Water transfer projects also cause conflicts in water-stressed regions, as evidenced in the Middle East and South Asia.
Global map of river basins with flow regulation and fragmentation
Figure 24. Fragmentation and flow regulation of global river systems disturbed by hydropower dams at the sub-basin level. The map was built using a dam impact matrix that measures the impact of dam construction on river fragmentation and flow regulation. The total impact was categorized into 16 classes with different color codes.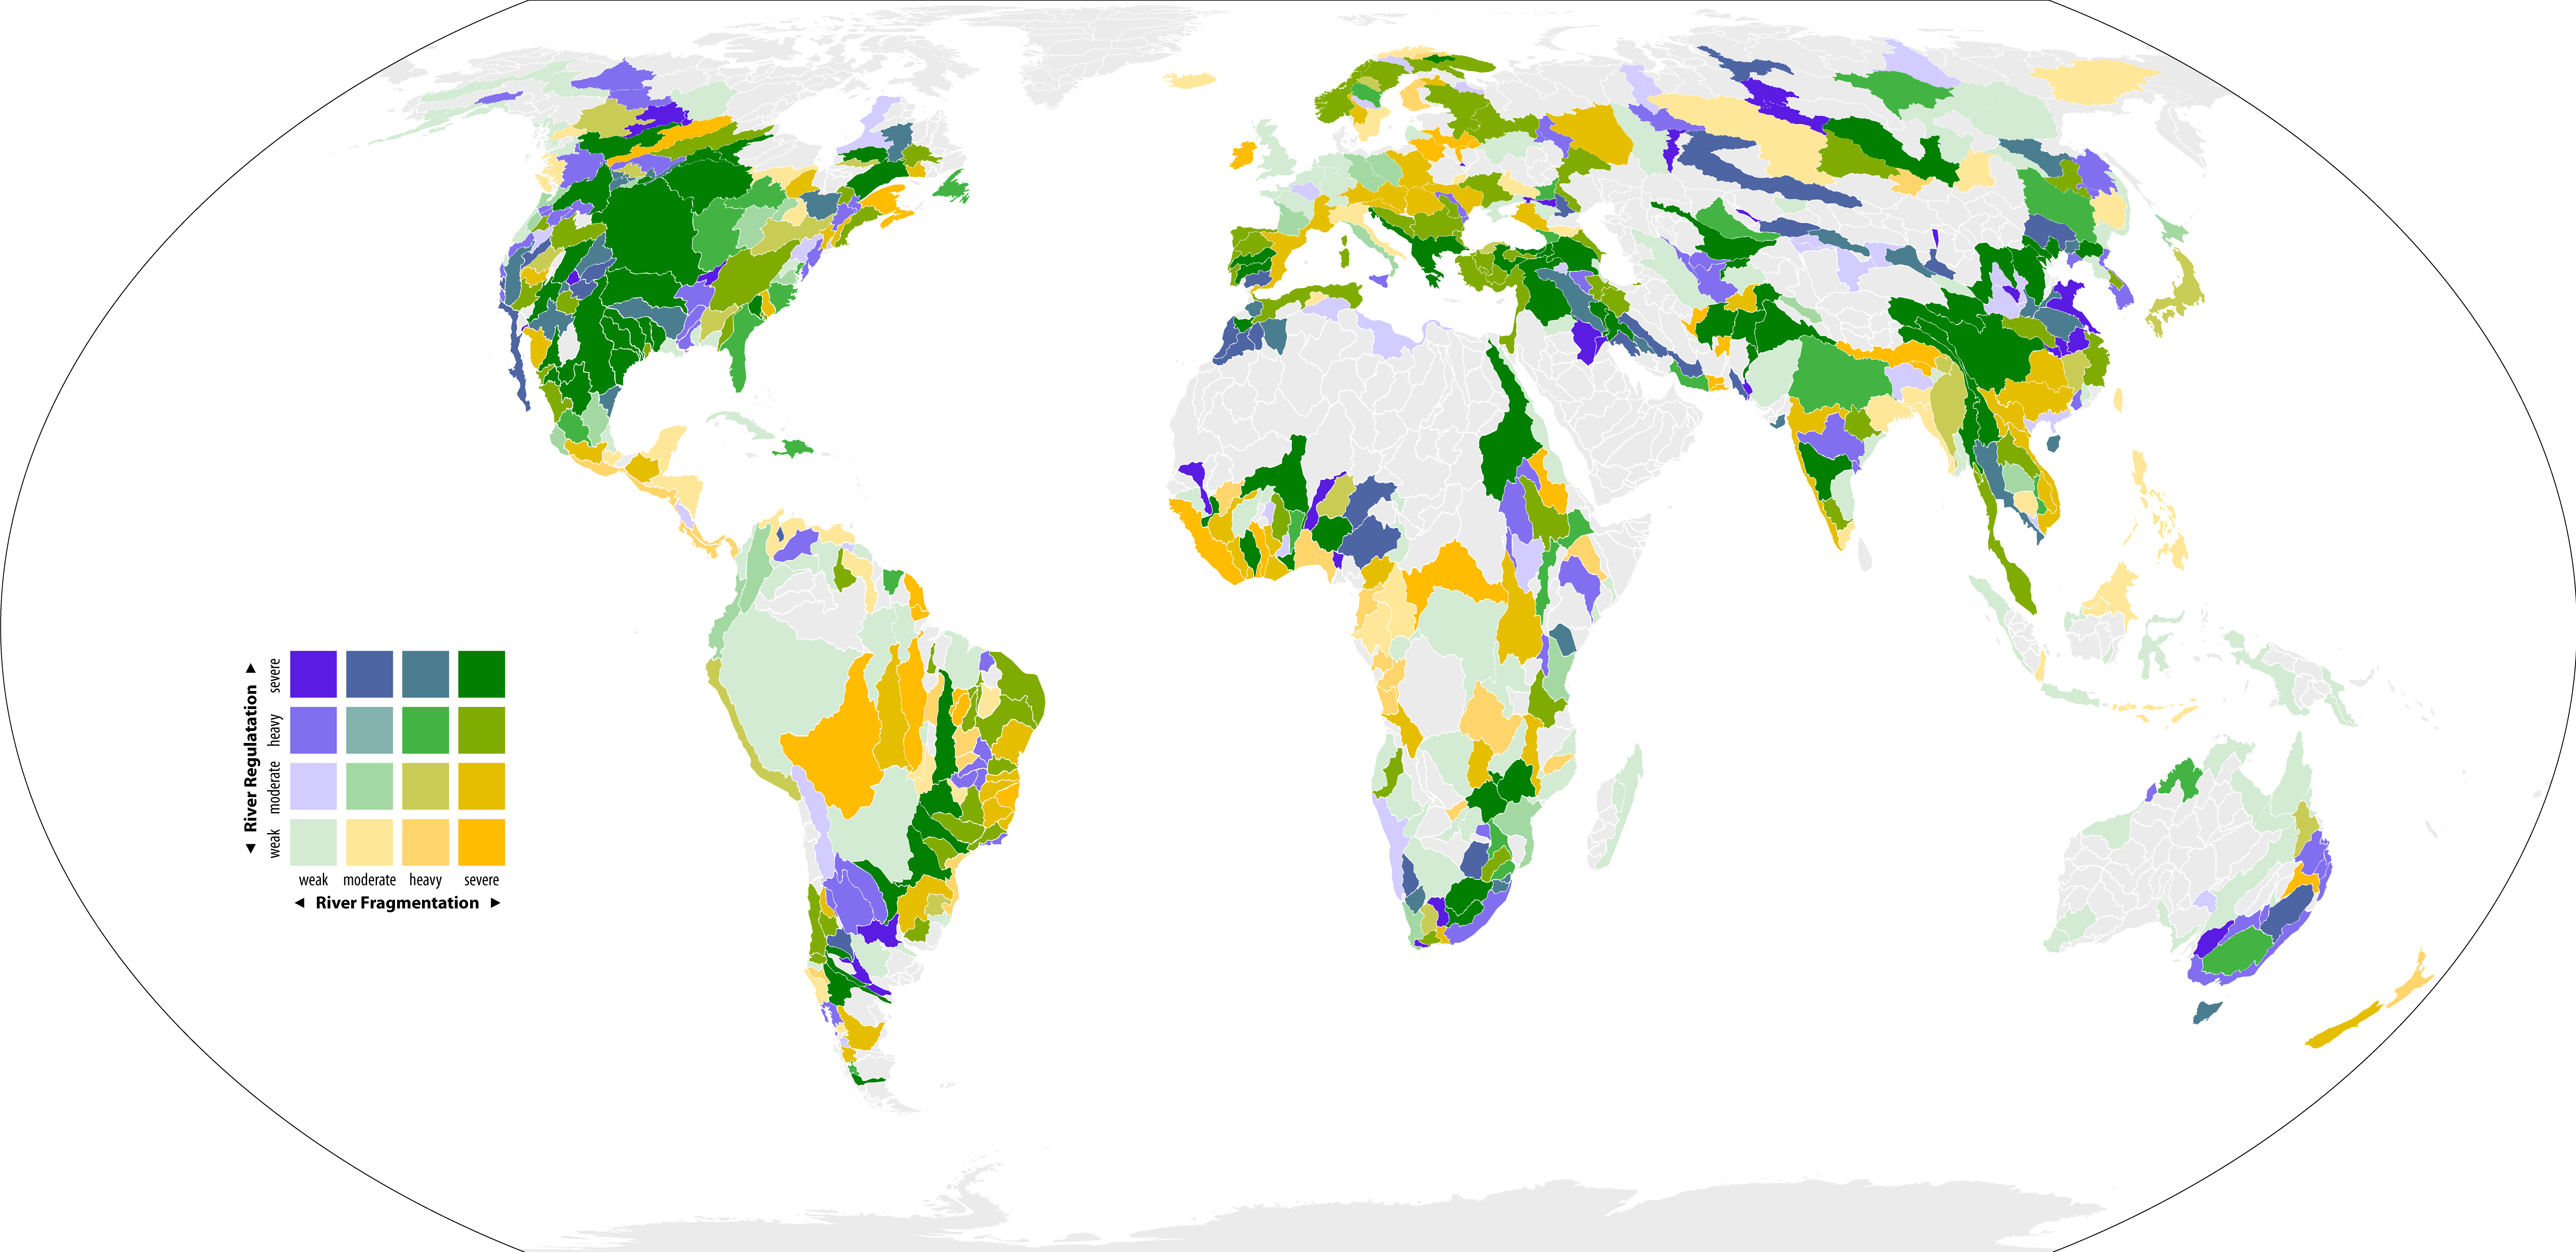
Industrial Risks
Reduced allocations for irrigation systems can reduce crop yields and overall financial returns in water-stressed regions. Water use competition can also increase water prices. For example, farmers in Colorado normally pay $0.05 to $0.08 per 1,000 liters of irrigation water. During water shortages, however, those prices can increase by a factor of 15 to 20 [152]. Climate change is causing additional threats, especially as more hydropower dams confront increasing drought and flood risks, which can negatively affect hydropower generation and water infrastructure. Declining water levels in the Colorado River have decreased the Hoover Dam’s hydropower capacity by 25% in 2021 compared to the 1930s, while also reducing boating and other recreational activities [153].
The lack of well-maintained infrastructure is another growing financial risk for companies, as the systems may not continue to provide reliable supplies. In 2020, thousands of residents were evacuated after the failure of two dams in Michigan due to heavy rainfall. The event caused an estimated $175 million in damages [154]. Maintenance of water diversion projects and cost-effective solutions for aging infrastructure are an ongoing challenge around the world. In the U.S. alone, more than 91,000 dams are at high risk of failure and need over $64 billion in repairs [155]. The high risk of aging infrastructure threatens the safety of residents, increasing the risk of large-scale displacement and social costs in the face of climate change.
Mitigation
Ongoing efforts to mitigate the impacts of water diversions are minimal. One effort includes water rights trading and allocations in countries, including the U.S. and China. In the U.S., there is a growing use of water trading, including programs in Arizona, California, and Colorado. These programs attempt to use the market to promote more efficient water allocation and use. Federal and state funding is also being used to retire water rights in over-appropriated sub-basins. In the Rio Grande basin in Texas, water rights are managed using a “first in time, first in right” priority system, and water below Lake Amistad is prioritized for all municipal accounts [156]. China has initiated a nationwide water rights pilot scheme that aims to develop regulations and guidelines at the national level on water rights verification, registration, and trading. To facilitate water rights trading, China established a water exchange market center in 2016 that provides services for trading consultation, technical evaluation, market information, intermediary services, and public services. These attempts could help reduce conflicts between water users through market reallocation to the users with the greatest need and potentially mitigate impacts of water diversion projects in basins. However, more inclusive social elements and concerns should be incorporated to ensure these schemes are effective and efficient and that they minimize impacts on communities and workers.
4. Metals Contamination
Metals can be toxic even in relatively low concentrations in water. They are also long-lasting and bioaccumulate. If untreated or inadequately treated, metals can damage natural ecosystems and pollute drinking water, threatening human health.
Industrial practices
The Materials and Information Technology (IT) sectors are the primary sources of metal contamination. Within the Materials sector, the Metals and Mining industry releases contaminants during raw material extraction. Acid mine drainage and the chemical agents used to separate minerals and ore can be a point source of pollution. The IT sector produces semiconductors, circuit boards, and batteries that release wastewater containing a variety of metals, including mercury, copper, iron, zinc, nickel, chromium, lead, tungsten, and lithium. E-waste from semiconductors, circuit boards, and batteries also contributes to metal leaching into water.
Global hotspots of metal concentrations in lakes and rivers
Figure 25. Mean concentrations of metals throughout Africa, Asia, Europe, North America, and South America based on metal sampling data in lakes and rivers from 1972-2017 [157]. Metals in the figure include cadmium (Cd), lead (Pb), chromium (Cr), mercury (Hg), zinc (Zn), copper (Cu), nickel (Ni), aluminum (Ai), manganese (Mn), iron (Fe), arsenic (As), and cobalt (Co).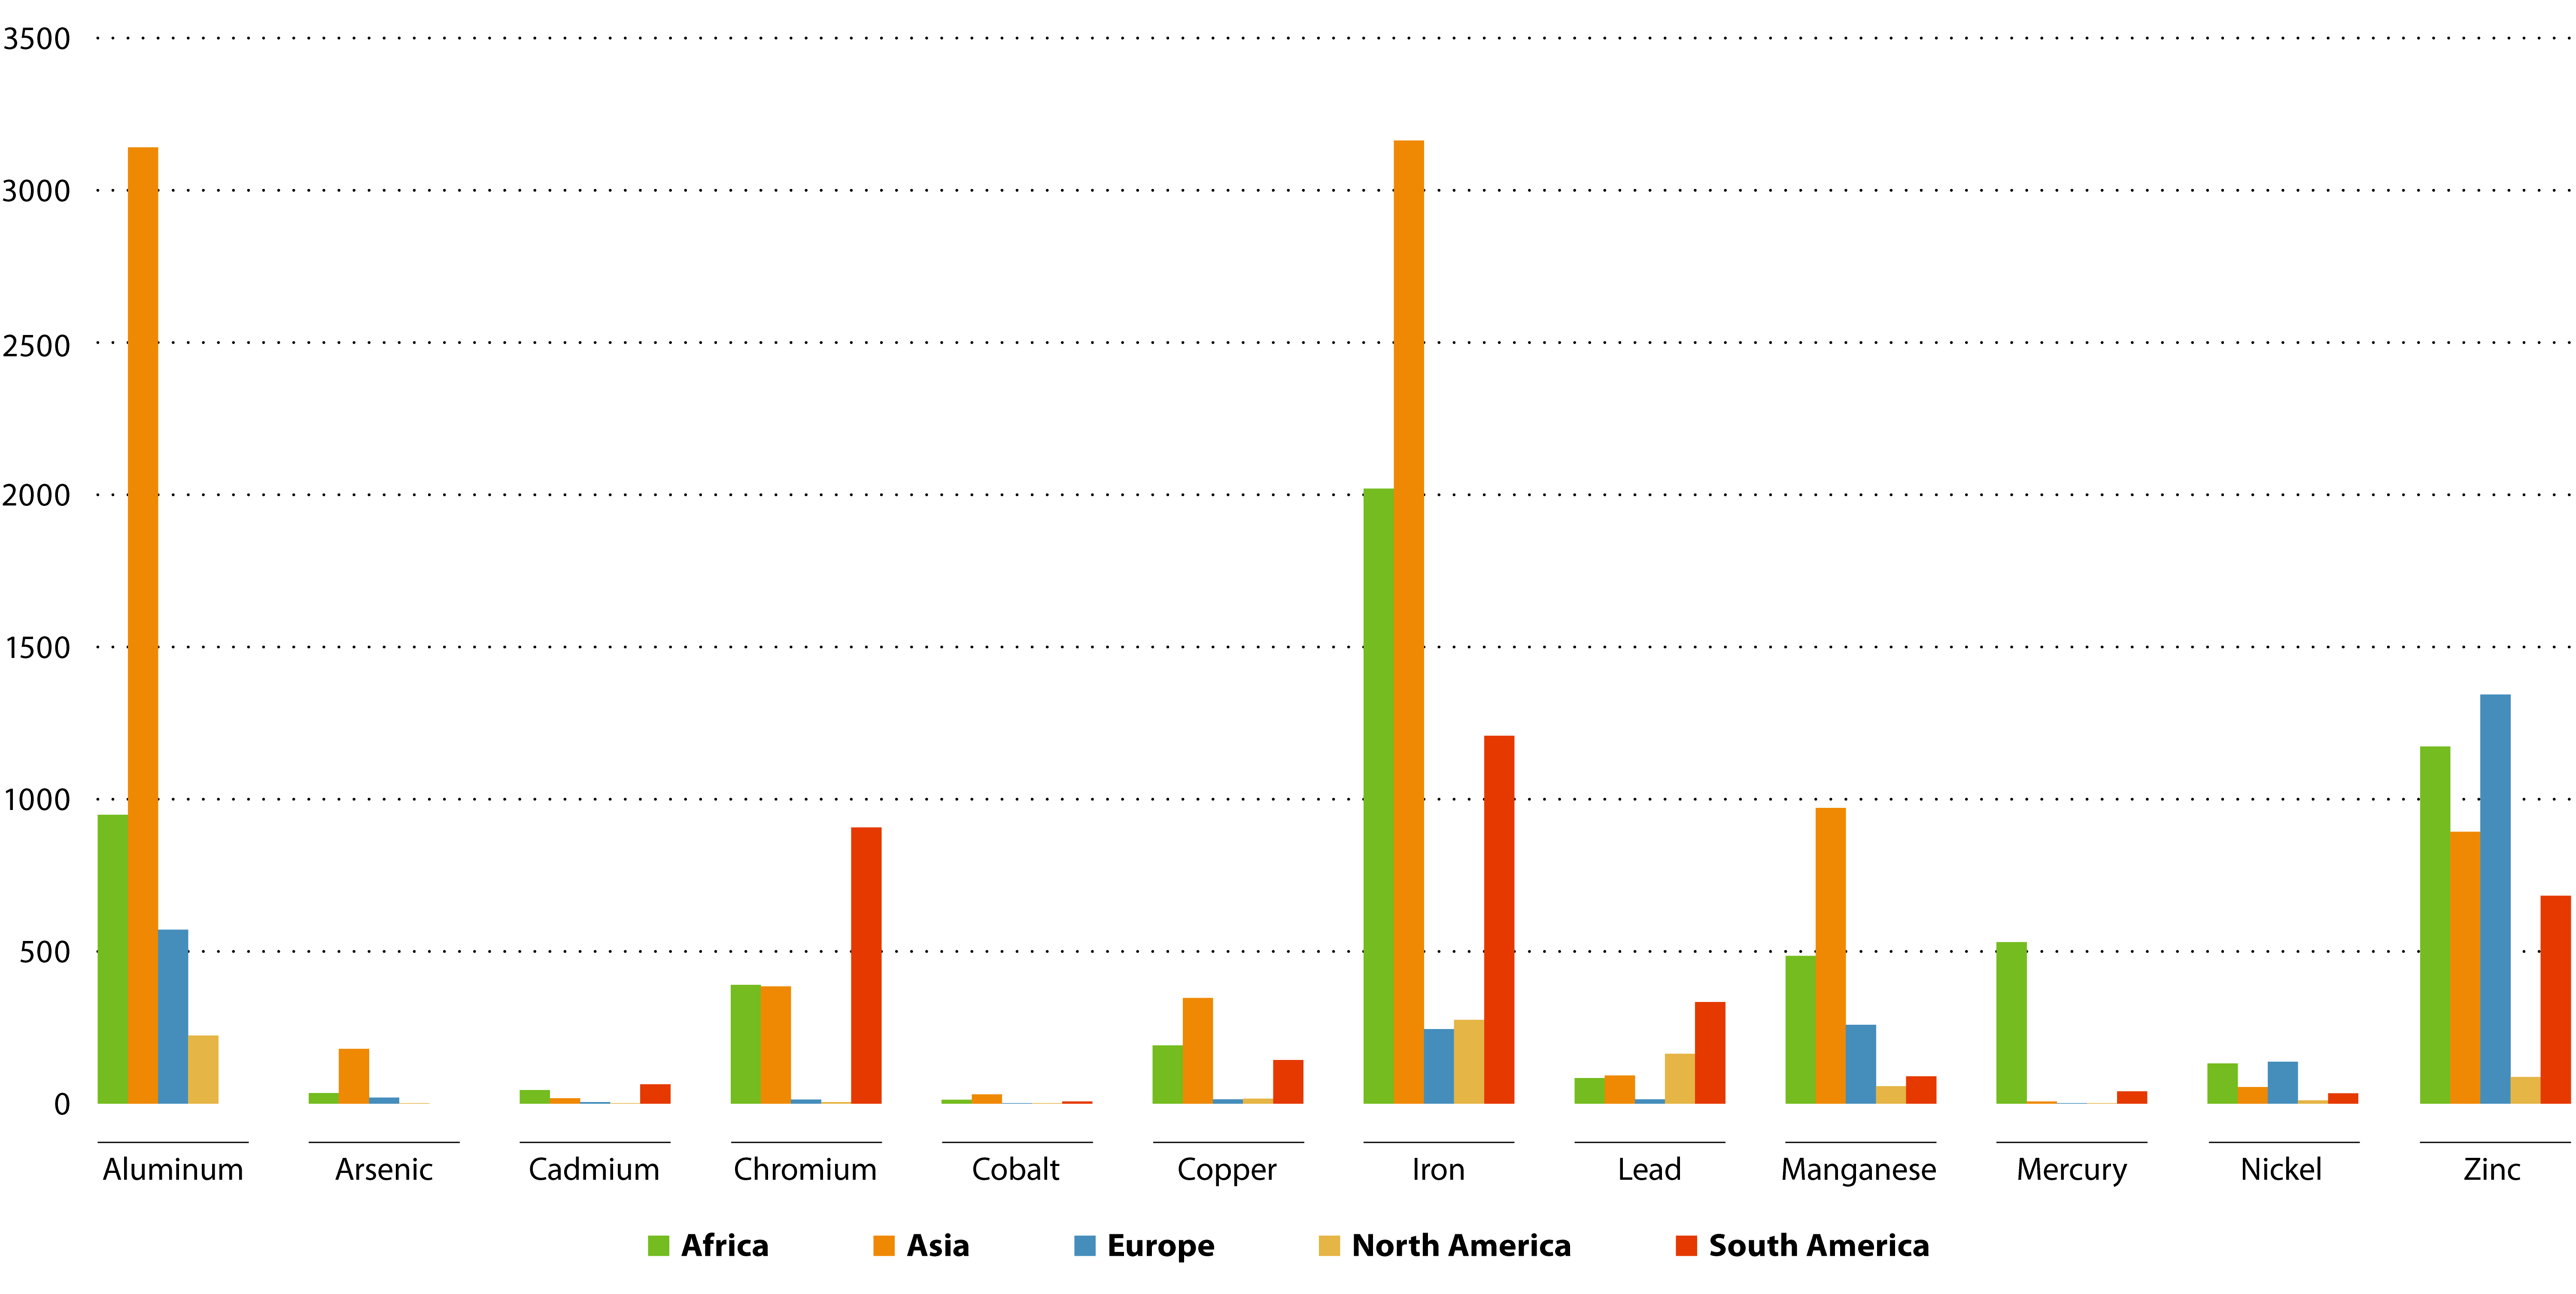
Global trends
Heavy metals are being found in high levels in rivers and lakes globally, with the highest concentrations in Africa, Asia, and South America, and lower levels (though still toxic) in Europe and North America, as shown in Figure 25. Based on sampled data published in academic literature from 1972 to 2017, a synthesis found that Asia accounted for approximately 42% of metals found, Africa 27%, Europe 12%, South America 16%, and North America 3%. Overall metal concentrations were lower in the 1970s and 1980s, and higher from 1990-2017 [157]. In this review of 12 heavy metals (Figure 25), lead and aluminum are two metals that have higher concentrations in the main rivers of North America—greater than the published threshold limits—as per the standards of the World Health Organization (WHO) and the EPA. Of the 12, the number of metals with concentrations found higher than these limits by continent are Europe (six), South America (seven), Asia (nine), and Africa (10) [143]. The situation is likely worse because data on the whole spectrum of metals are underreported. Metal concentrations are higher in developing nations due to the lack of environmental regulations and wastewater treatment. In China, there are approximately 1.5 million sites with heavy metal exposure, releasing an estimated 740.15 tons of heavy metals into water bodies in 2011 [158].
Industrial risks
Many countries with mining operations are experiencing declining water availability, including Peru, Chile, Australia, South Africa, and Mongolia [159]. Given that mining operations are tied to locations where the resources exist, companies do not have the option to transfer operations to less risky environments. According to a 2020 CDP report, 91% of Metals and Mining companies that responded reported exposure to water-related risks, with an estimated financial impact of $24.9 billion [160].
With increasing social and government scrutiny of the impacts associated with industry, the costs of wastewater treatment for companies will likely increase. While the costs vary depending on the mining activity, current estimates find that metal waste management practices typically account for at least 2% of total cash costs of companies. [161].
Mitigation
Some companies have implemented water treatment techniques, including common membrane filtration, activated carbon adsorption, and electrocoagulation, to reduce metals discharges [162]. However, if regulations are weak, which they often are, there is less motivation for companies to adopt advanced technologies since they are expensive and energy intensive. This is usually the case in many low-income and developing countries. There are cheaper alternatives that can be used for the absorption and removal of heavy metals, such as coconut shell, almond shell, fertilizer slurry, palm tree cobs, petroleum coke, and pine saw dust. These low-cost materials have been found to remove over 90% of various metals, such as cadmium and zinc [163].
5. Plastic Pollution
Plastic is a relatively cheap and lightweight material that many industries use for production and packaging, making it ubiquitous and a major source of global water pollution if not managed appropriately. The world produces more than 405 million tons of plastic each year, 3.5% of which ends up in our oceans, becoming a major pollutant and impacting aquaticspecies through entanglement and ingestion of plastics.
Microplastics (plastics less than 5 millimeters in size) are of particular concern because of their persistence in the environment and bioaccumulation in food chains (given their small size, they can easily enter the bodies of living things).
Up to 80% of plastics that end up in the world’s oceans are transported by rivers [164]. A study in California was the first to report concentrations of microplastics in river surface waters through sampling in the Los Angeles River, San Gabriel River, and tributary Coyote Creek [165]. For a given location, the study found up to three orders of magnitude difference between plastic concentrations measured during dry and wet periods, implying that runoff plays an important role in the transport of plastics into freshwater systems.
Global map of plastic waste input from rivers into the oceans
Figure 26. Map of river plastic flowing into oceans [67].
Industrial Practices
Plastic waste is generated from many industrial sectors through a wide range of practices, ranging from raw material extraction and packaging to end-of-life product use. The Consumable Staples and Consumer Discretionary sectors are two major sources of plastic pollution, including microplastics, due to the packaging of their products and washing and maintenance of textiles. Plastic packaging is widely used in the Food and Meat Packaging, Beverage, Household and Personal Products industries (all industries within the Consumable Staples sector). Personal product use and vehicle tire abrasion also contribute significantly to plastic pollution. A global report estimated that washing synthetic textiles and tire abrasion from driving are the largest sources of microplastic water pollution, accounting for two-thirds of total microplastics released [166]. Microplastics are typically released from domestic wastewater systems and through urban and stormwater runoff.
A major source of plastic pollution is the improper disposal of end-of-life products. Poor waste management in Asian countries has resulted in them being a top hotspot for producing plastic pollution [67]. Single-use products, such as plastic food serviceware, that are commonly disposed of improperly can easily flow to water bodies creating massive volumes of plastic pollution [167].
Plastic waste also has associated harmful chemicals that can impair waterbodies and harm aquatic species. These chemicals are normally divided into three categories: the ingredients of plastic materials; the byproducts of manufacturing plastics; and chemicals from the environment absorbed by plastic pollution. If ingested by species, plastic pollution can lead to toxicological responses, which are caused by chemical additives to plastics, including heavy metals, pesticides, polycyclic aromatic hydrocarbons (PAHs), and polychlorinated biphenyls (PCBs). These chemicals can disrupt important physiological processes of organisms, causing disease and reproductive issues. Thousands of additives are used in plastic production, many of which are well-known environmental contaminants that accumulate in fatty tissues of aquatic animals. A recent study illustrated how plastic pollution generates diverse risk potential because the chemical additives to plastic are continually evolving, while the synergistic effects of the various chemicals remain unknown [168].
Global trends
Global plastic production continues to proliferate, growing at a compound annual rate of 3.5% in the past 10 years alone. Up to 14 million tons of plastic waste end up in oceans every year, 80% of which come from river systems. That is equivalent to setting eight garbage bags full of trash on every foot of coastline around the world [169]. Approximately 20.94 to 25.35 million tons (11%) of plastic waste generated globally in 2016 entered aquatic ecosystems. This volume could reach up to 58.42 million tons per year by 2030 [170]. In Europe, studies estimated that the Danube River releases 584–1,653 tons of plastic into the Black Sea annually [171].
A review of 340 original publications on the topic reveals that at least 690 different species have been impacted by marine debris globally - 92% of which is due to plastic marine debris [172]. A World Economic Forum report forecasted that plastics will outweigh fish in the ocean by 2050 [173].
The global distribution of plastic pollution is not uniform, since different countries have greater discharges into the ocean, particularly Asian countries [174]. The top five countries identified as having the most mismanaged plastic waste systems are China, Indonesia, the Philippines, Vietnam, and Sri Lanka. Rivers, themselves very polluted with plastics, transport plastic pollution to oceans. Asian rivers account for an estimated 86% of total plastic releases to ocean waters globally. The rest of the world accounted for the remaining 14% of river plastic mass input (Africa 7.8%, South America 4.8%, Central and North America 0.95%, Europe 0.28%, and Australia-Pacific 0.02%) [174]. In Asia, the Yangtze (China), Ganges (India), Xi (China), Huangpu (China), and Javanese, and Brantas (Indonesia) rivers carry significant plastic pollution loads to the ocean. Plastic pollution is also a growing concern in the African Great Lakes, including Lake Victoria, the world’s second largest lake, where one in five fish have ingested plastic, according to a 2019 study [175]. A classic transboundary challenge, most plastics production and dumping are in developing countries, while the biggest users of plastics are developed countries.
Industrial risks
Plastic pollution poses a major reputational risk to companies, as public awareness of its impacts grows. Many public advocacy groups are urging companies to use less plastic material and seek sustainable alternatives. The Beverage industry has been front and center in these debates. Globally, millions of tons of single- use plastic beverage bottles are produced every year that are not properly disposed of, ending up in waterways or landfills that are mismanaged and are a pollution source [176]. The increasing advocacy for corporate action around plastics has helped bring more attention and action on the issue [176]. In response, some companies have tried to develop new types of packaging that use less plastic or alternate materials that may be less harmful when in the environment. For example, some companies have produced single-use packaging products from plant-based materials. However, it is often unclear how these alternative products will persist in the environment and if there will be in fact less of an impact if disposed of improperly. If additional actions that fully address the entirety of the problem are not undertaken, industries and companies will face additional reputational risks.
Mitigation
Mitigation paths for plastic pollution include a reduction in the use and phase-out of single- use plastics and small plastic particles (microplastics), along with additional and improved wastewater and runoff treatment. Many countries and regions have undertaken policy and regulatory initiatives to prevent plastic pollution from entering waterways through the development and implementation of advanced technologies. Government agencies, such as the regional water quality control boards in California, have enacted urban runoff and stormwater discharge restrictions to capture plastic pollution before it enters a water body through the use of full capture technologies [177]. California’s Ocean Protection Council also initiated a multi-year roadmap aimed at establishing the state as a national and international leader in managing microplastic pollution through a two-track approach to managing microplastics in California: immediate actions with multi-benefit solutions and research to enhance science-based solutions [178].
In addition, many governments have imposed restrictions on the use of single-use plastic products to limit their proliferation in the environment. For example, the Canadian federal government recently released draft regulations to ban six kinds of harmful single-use plastic (straws and stirring sticks, six-pack rings, grocery bags, cutlery, and difficult-to-recycle takeout containers) [179]. Many local communities globally have already taken similar regulatory action to curb single-use plastics use and drive the use of reusable alternatives.
Water treatment techniques for removing microplastics include common membrane filtration, activated carbon adsorption, and electrocoagulation. Some technologies specifically focus on collecting microplastic waste in waterways, but the implementation and effectiveness is limited [180].
Climate Change — A Threat Multiplier
Climate change is directly impacting the global water cycle and the distribution and availability of freshwater around the world. Increasing temperatures, melting ice sheets and glaciers, changes in the distribution of water, and uncertainty associated with climate change all intensify the impact and development of critical threats to freshwater. These impacts on freshwater will also increase risks to industries that rely on freshwater resources. Responding to these critical threats will require more focused consideration of climate change’s role as a threat multiplier.
Rising temperatures and eutrophication
Climate change is already leading to increased water demand because of rising temperatures, increasing evaporation, and more frequent droughts, all of which combine to decrease water availability. Warmer temperatures promote algal blooms in freshwater systems, which are occurring more in freshwater bodies. Such eutrophication is driven by excessive nutrients, abundant sunlight for photosynthesis, and suitable temperatures for rapid plant growth. Climate change is causing rising temperatures, more intense storms, and earlier snowpack melt, intensifying nutrient runoff and eutrophication in more areas of the globe.
Climate change, groundwater depletion, and contamination
Climate change is driving greater water demand in water-stressed regions, often leading to significant depletion of groundwater resources. Groundwater withdrawals for irrigation in drylands, including in California, Northern China, and India, are now more visible than ever before [10]. Groundwater extraction often exceeds local groundwater recharge capacity, stressing the availability of this critical resource to many industries, in particular industries with agricultural supply chains.
The melting of glaciers and polar ice caps is driving sea level rise, threatening inundation of major population centers and critical agriculture zones. Rising sea levels are increasing the frequency of storm surges and causing seawater intrusion, resulting in the salinization of key aquifers and threatening industrial activities along the coastal zones. In Sonora, Mexico, seawater intrusion from the Gulf of California has occurred in several coastal irrigation districts, resulting in salinity concentrations that limit water use for irrigated agriculture [181].
Changing precipitation patterns and extreme climate events
Climate change is expected to further alter the water balance in many parts of the world, changing the patterns of precipitation in space and time. Warming temperatures have already increased the frequency and intensity of extreme weather events around the world.
Warmer air holds more moisture, which can translate into heavier rainfall and stronger storms, causing extreme floods and flash floods. These intense storms can lead to increased risk of pollution overflows that can overwhelm waste treatment facilities. Heavy precipitation also increases the chance of potential leaching from hazardous waste and mine tailings sites. Increased storm events will also intensify runoff, releasing pollutants, such as microplastic and veterinary pharmaceuticals. Warming temperatures are melting glaciers and increasing the release of PFAS into marine and fresh waters [182]. The worst scenario shows that strong storms could become as much as 14 times more common by 2100 across Europe compared to the beginning of this century [183]. Flood damage in Europe, particularly in northern European regions, could increase from current levels of €7.8 billion annually to €48 billion by 2100 [184].
At the same time, drought leads to a decrease in water volume and increased concentration of chemical and biological pollution, increasing stress and toxicity on ecosystems dependent on that water. A recent estimate shows that the absence of climate action (4 °C in 2100 with no adaptation) could increase annual drought losses in the European Union and the U.K. from the current level of €9 billion annually to more than €65 billion, which could reduce regional agriculture economic output by 10% [185].
Extreme events accelerated by climate warming increases risks to industries at various levels. From floods to crop failure due to excessive heat, the impact on industries, including agriculture, manufacturing, and mining are significant. According to insurance company Swiss Re, the world will lose 18% of its current GDP by 2050 if no mitigation action is taken against climate change, with Asia being hit the hardest.
Changes in streamflow and streamflow alteration
As global temperatures increase, the cumulative impacts of rapidly melting glaciers and ice sheets and changes in annual snowpack will significantly alter stream flows[186]. When this impact is combined with increasing freshwater extraction from rivers and river fragmentation, the impact on river ecosystems will magnify[151]. As climate change intensifies water scarcity and weather patterns, the global distribution of water will become less balanced, triggering more water diversions to support energy and food production. This imbalance could also catalyze more migration towards water secure areas [187].
The disappearance of mountain glaciers is increasing the frequency of melt-induced disasters, including floods and landslides, and risks to glacial-melt water supplies. These consequences will become more serious in high mountain and foothill areas, threatening multiple industries. For example, the shrinking of the Andean glaciers has diminished spring flows in the headwaters of the Querococha basin in Peru and reduced water availability in dry seasons, which has affected livestock productivity. The disappearance of glaciers has also negatively affected the tourism industry in many mountain areas, including Austria, Canada, and Switzerland [188].
Other Emerging Threats
Recent research that includes economic and environmental projections highlight additional emerging threats to freshwater resources that are not well understood, requiring heightened attention from industry and policymakers. These emerging threats are intricately linked with industry practices that are expected to grow in the coming years and have recently been identified as threats. For example: even as thousands of pharmaceutical drugs are polluting water resources across the U.S., most of them are not subject to federal safety limits and are currently not being measured in drinking water supplies or being removed during wastewater treatment processes. Per- and polyfluoroalkyl substances (PFAS), a group of artificial toxic chemicals known as “forever chemicals” (since they never break down), are widely used to make various types of everyday products, but they are also largely unregulated. In fact, public water systems in the U.S. are not required to monitor for any PFAS. As global demand for everyday products continues to grow, identifying and responding to these emerging threats must be an important priority in the years ahead.
Emerging threats identified through the assessment.
Figure 27. Chart of emerging threats as identified through the literature review.
(I) PFAS
Per-and polyfluoroalkyl substances (PFAS) are a group of artificial chemicals widely used by industry to create non-stick coatings on cookware, carpets, and food packaging. PFAS, also known as “forever chemicals,” are highly persistent and bioaccumulate, becoming a critical toxin in surface and drinking water. It is nearly impossible to avoid PFAS which is used in brand-name products like Scotchgard, Teflon, and Gore-Tex. They have been found in water, air, food, and blood, making them a key emerging issue for environmental and human health. PFAS water contamination is primarily associated with Chemical sector discharges, specifically fluorochemical production effluent. Other sectors using PFAS include Consumer Staples, Consumer Discretionary, and Textiles. For all of these industries, PFAS are released mostly in domestic wastewater and leaching from landfills. A recent study found nearly 42,000 potential sources of PFAS that are coming from more than 120,000 locations across the U.S. The testing found that a significant portion of landfills and industry sites in Michigan and California were discharging PFAS at unacceptable concentrations, while oil and gas industry is ranked as the biggest user of PFAS [189].
PFAS have been found in all parts of the world, including glaciers where PFAS have accumulated in Arctic Sea ice through atmospheric transport, which will release more PFAS as ice caps melt [190]. PFAS have been found in drinking and coastal marine waters, primarily in western Europe, China, Korea, Japan, and North America. Testing and data is limited in South America and Africa [190]. PFAS have many human health implications, including cancer, thyroid disease, high cholesterol, liver damage, kidney disease, low birth weight, immune suppression, ulcerative colitis, and hypertension.
PFAS could be a potentially expensive liability for major industry users. In 2018, 3M reached major financial settlements with the states of Minnesota and Alabama over water contamination from these chemicals. The Minnesota settlement was for $850 million [191].
To mitigate this growing threat, the Stockholm Convention on Persistent Organic Pollutants in 2015 added PFAS as a compound that needs to be phased out. New actions are being taken to mitigate the threat, such as the adoption of the Toxic Substances Control Act in the U.S., which requires PFAS manufacturers to provide information on PFAS [192]. Other steps include wastewater treatment and setting limits for drinking water.
(II) Pharmaceuticals
Modern medicine has widely expanded different treatments and drugs that are available and essential for human health. However, there has been less focus on the environmental threats that these life-saving pharmaceuticals are creating. Many wastewater treatment plants are not equipped to remove these complex chemical compounds, which, as a result, are being continuously released into water bodies [62]. Researchers have pointedly noted that escalating releases of so many prescriptions and over-the-counter drugs in water resources will have long-term damaging impacts on human and environmental health [62]. The Health Care sector is the primary source of pharmaceuticals, whether from drug production effluent, hospital effluent, or consumer use. The Consumer Staples sector is another emitter, through veterinary pharmaceuticals used on-farm in agriculture to treat and prevent disease within farm animals.
Pharmaceuticals are ubiquitous in water bodies worldwide and have been identified in surface water, groundwater, drinking water, manure, soil, and other environmental matrices in every continent in the world [60],[65]. However, the full extent of the impacts from many of the most common pharmaceuticals in waterbodies remains unknown [65]. Between 1995 and 2015, research found that pharmaceutical-related risks to global aquatic ecosystems have risen 10- to 20-fold [193]. Studies show that pharmaceuticals in water can impact antimicrobial and antibiotic resistance, create toxicity and endocrine disruption in organisms, and affect reproductive health in humans. Antimicrobial resistance leads to bacterial evolution and drug-resistant strains, creating a significant health hazard. It has been estimated that socioeconomic impacts of antimicrobial resistance will cost $3.5 billion per year to the healthcare services of the 33 OECD and EU countries between 2015 and 2050 [194]. Policy instruments to mitigate pharmaceuticals threats include substance bans, stringent water quality standards, industry discharge permits, and subsidies for “green” innovation.
(III) Social conflicts
As the world continues to consume and divert more water at an alarming rate, downstream nations are at risk of being left behind, and this will only worsen with climate change. Increasing water use by the private sector undoubtedly contributes to rising tensions and conflicts as communities, companies, and entire countries compete for clean water to provide drinking water, food, and energy security. Economic sectors that have triggered social conflict include the Consumer Staples and Energy sectors due to their water intensive activities related to food production, food and beverage manufacturing, and energy production. Water withdrawals from rivers, reservoirs, and groundwater in water-scarce areas will be especially prone to social and political conflicts. Water-driven conflicts are already occurring in the western U.S., northern Africa, Ecuador, India, Syria, and Taiwan.
Companies are starting to be impacted by government actions to ensure critical water needs are met. For example, in 2021, Taiwan’s government reduced water supplies to the country’s massive chip manufacturing sector due to a prolonged drought. Taiwan has also experienced water pollution conflicts between the semiconductor industry and residents.
Efforts have been made by industry, governments, and other stakeholders to solve conflicts among water users, such as broad-based engagement of water users fostering shared decisions about the management of water resources. For example, The Restoration Initiative (TRI), a project implemented by United Nations Environment Programme with broad stakeholder engagement, has successfully helped over 100 villages in Kenya’s Tana river delta restore and better manage their land and water resources, reducing long-term local tensions between local farmers and animal herders [195]. But far bigger actions, both by industry and governments, are urgently needed.