Appendix A - Methodology: Data Collection and Processing
Summary
The systematic review process [196] was applied, combined with a bottom-up and top-down approach for data collection and review as explained in the following appendices. The bottom- up method was used based on big data analytics of the raw data from key industries and sectors that have relatively high occurrence of mentions among studies. The topdown method was employed to solicit expert consultation and target searches to improve the quality and coverage of data. Both approaches are explained further in Appendix B and C.
Data coverage
This report primarily explores industry impacts on freshwater. The data for this synthesis report is drawn from academic publications and grey literature. Academic publications are peer-reviewed papers that include review articles, research papers, and technical reports. Grey literature includes reports from various institutions and organizations, policy documents, working papers, theses, and news articles. Relevant data were retrieved from publications spanning from 1950 to January 2021.
Data retrieval
A keywords-based strategy was employed to identify relevant records in the literature. Figure A28 illustrates the logic structure of the application of the keywords-based strategy for data retrieval. It should be noted that the words in the boxes are examples that help to clarify the process. In general, the search strings contain three parts named the objective layer, the synonymous layer, and the operating layer (with the constraint). The objective layer specifies target objects (i.e., industry and water in this case) and the synonymous layer includes synonyms corresponding to those words in objective layer. Given that the report aims to synthesize evidence, theoretical and lab-based studies are viewed as irrelevant. Such exclusion was identified using a joint, automated, and manual process, which is further explained in the next subsections. The combinations of words, as search strings, are then applied to retrieve raw data from key databases, such as the Web of Science, Scopus, and Google Search.
Figure A28. Exemplified strategy for keywords-based data retrieval
The data collection process was made up of three parts: scoping review of existing academic review papers, target search for grey literature, and identification of available studies in a broad sense.
Scoping review
A scoping review is a relatively new approach for evidence synthesis. It is complementary to systematic review in that it can provide a quick overview of a study field before conducting detailed systematic review. It can therefore help to map out broad topics and determine the potential scope [197]. For this assessment, a scoping review was conducted to investigate the main industrial impacts on water that have been frequently studied and to avoid repeating existing work.
Using the search strategy shown in Figure A28, 1,985 records were initially identified from both the Web of Science and Scopus (two widely used academic bibliographic databases), and 21 reports (review documents) were found from Google and target searches within websites and databases of national and international institutions.
Apart from the 21 review documents, an additional 235 grey literature documents were found using target searches on Google Search Advances and reputable institutions. The target institutions include Accenture, CNN, Ceres, the Food and Agriculture Organization of the United Nations, KPMG, the New York Times, Pacific Institute, SEI, the Stockholm International Water Institute, Thomson Reuters, the UN, the World Bank, the World Health Organization, WRI, and WWF. All the documents were later screened to identify those most relevant for the assessment.
To identify all available evidence, a set of broader word combinations were developed for the topic search for data from the Web of Science. The topic search means that all the records were retrieved from the database if they contained any of the developed words or word combinations in their title, abstract, or keyword list. This process reduced potential bias of the review. That is, the review should not be restricted to any industries that have been identified in review reports and not be biased by the experts’ opinions but be guided by what is available in the literature.
The initial search returned more than 3 million records which, after the additional scoping exercise, was reduced to 333,458 records (Table A4).
Table A4. Search strings for broad academic evidence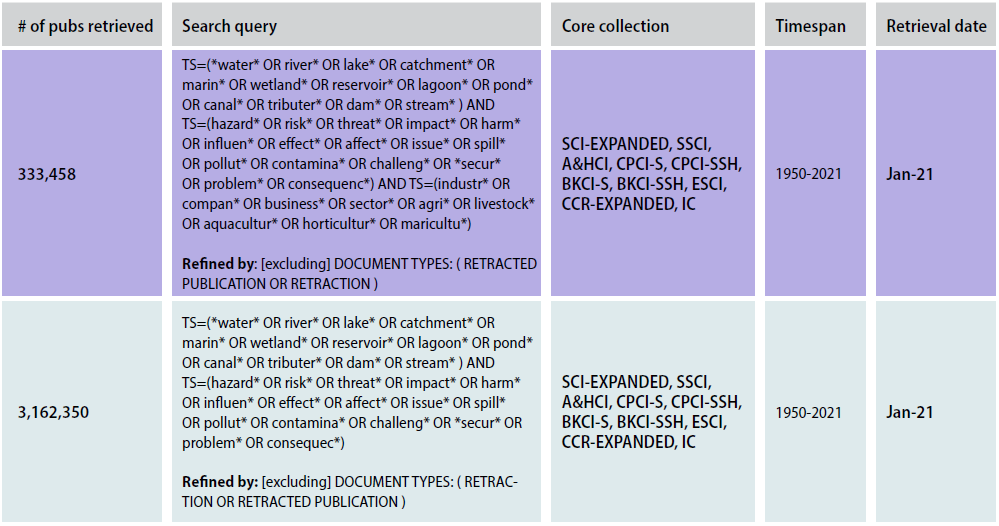
Data processing to establish the bibliographic database
Scoping review data
For the scoping review data, the initial 1,985 records (after removal of duplicates) were further reduced by screening the titles and abstracts to exclude irrelevances. Irrelevant literature was classified as those that contained the developed keywords but did not really report impacts from specific industries on water systems. Papers that contained relevant contents in their titles but were unclear in their abstracts in terms of scope match were evaluated by a second round of full-text assessment. As a result, a total of 113 review papers and 20 grey literatures remained, making up the dataset of the scoping review.
Grey literature data
Similar to the review data, the initial 256 grey literature documents were further screened and those having no full text or having less content on industrial impacts on water were removed. The final screening generated a list of 149 documents, which were then grouped into 38 primary documents for further full-text assessment and 111 complementary documents for additional review.
Broader evidence data
For the broader dataset, automated big data analytics, combined with two rounds of manual screening, were undertaken. The automated analysis applied a citation network analysis with a text-mining approach to all papers obtained from the Web of Science. More specifically, networks among papers were generated using the direct citation relations extracted from bibliographic data. In other words, if paper A cites paper B (displayed as nodes in the network), then A and B are assumed to have close or similar concerns and are thus linked by an edge (displayed as a line between the two nodes in the network). Papers that have no citing and cited relations with any others are removed from the network (step 1 and 2 in Figure B29). This networking process helped to reduce initial data records from 333,458 to 227,315.
Furthermore, a text mining approach was performed to remove more papers from further review. Text-based data mining and analysis uses machine-learning artificial intelligence with natural language processing to translate human language so that computers can understand and analyze the importance of documents to this study. The approach focused on extracting key terms from the documents in the networks. All key terms were then ranked by the frequency-inverse document frequency (TFIDF). TF-IDF is a measure to assess the importance of a word to a document in a collection of documents. The higher the score of TF-IDF, the more relevant and important the word is to the document. The text mining approach helped to further reduce data records to 123,913, to establish the third dataset. All three datasets are composed of the knowledge base of available evidence on industrial impacts on water.
Appendix B - Methodology: Key Sector and Industry Identification
Summary
In this report, key sectors and industries were defined as those that are frequently mentioned in literature. These identified sectors and industries provided a direction to determine core papers from the developed bibliographic database. It should be noted that less frequent mention of an industry in the literature does not necessarily mean the industry has less of an impact on water. It could simply mean that less research has been done on it. For example, the emerging impacts of the pharmaceutical industry could have more harmful impacts on water quality than the mining industry because more than 70% of pharmaceutical substances in water and their impacts on the human health remain unknown. Nevertheless, using occurrence frequency provides an efficient way to identify relatively important industries from such a large dataset. To identify key sectors and industries, a cluster analysis of the constructed networks and text mining of all industries and their frequency of occurrences were performed.
Cluster analysis of networks
The constructed networks were clustered into groups based on a modularity maximization and optimization algorithm that analyzes the structure of large networks [198]. The principal workflow of the analysis is depicted in Figure B29. Following the first two steps explained in the previous section, the processes of cluster analysis and text mining of key industries are described as steps 3 and 4 in the figure.
Figure B29. Automated analysis of the big dataset on available evidence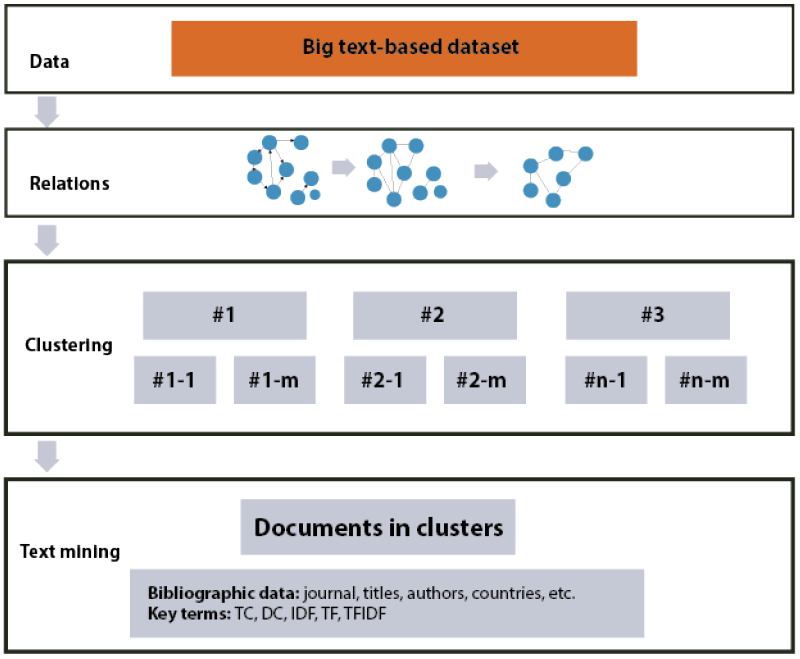
Modularity is a measure used to assess the structure of networks. Modularity maximization is the most widely used method for network community detection. It defines a benefit function (modularity) that measures the quality of divisions of a network into communities (clusters). When the modularity is maximized in a network, the structure of the network is well divided. Modularity optimization defines structure of the network that minimizes connections among divisions of communities (clusters) [198]-[200]. Within the algorithm, the automated clustering process runs iteratively until the number of clusters are optimized. The algorithm is specifically suitable for the clustering analysis of large networks due to its computational efficiency and the high quality of the results it returns [201]. The clustering analysis of the networks helped obtain groups of papers that reflected dominated research topics.
Using the clustering method, the entire network was divided into 147 clusters with more than nearly 900 thousand links. Figure B30 displays the key processes of clustering analysis. The top panel in Figure B30 shows the distribution of numbers of papers in all the clusters. It can be seen that the first 29 clusters dominate the network. As a result, these 29 clusters were included as the main data for further analyses.
To better summarize research topics represented by each cluster, iterative clustering analyses were performed to those clusters that contained more than 1,000 papers in order to generate sub-clusters (the bottom of Figure B30). A total of 498 sub-clusters were generated from 29 clusters. For each sub-cluster, top clusters were included which cover more than 95% of the total number of papers.
Text mining of key terms and TF-IDF enabled the identification of the core research topic of each cluster. If irrelevant studies were found in some clusters, a data cleaning process was conducted that focused on screening out irrelevant clusters by examining titles combined with key terms extracted from each cluster. Using this approach, nine clusters were removed from the top 29 clusters. With the remaining 20 clusters, some irrelevant subclusters were also removed.
Figure B30. Processes of clustering analysis of networks with an example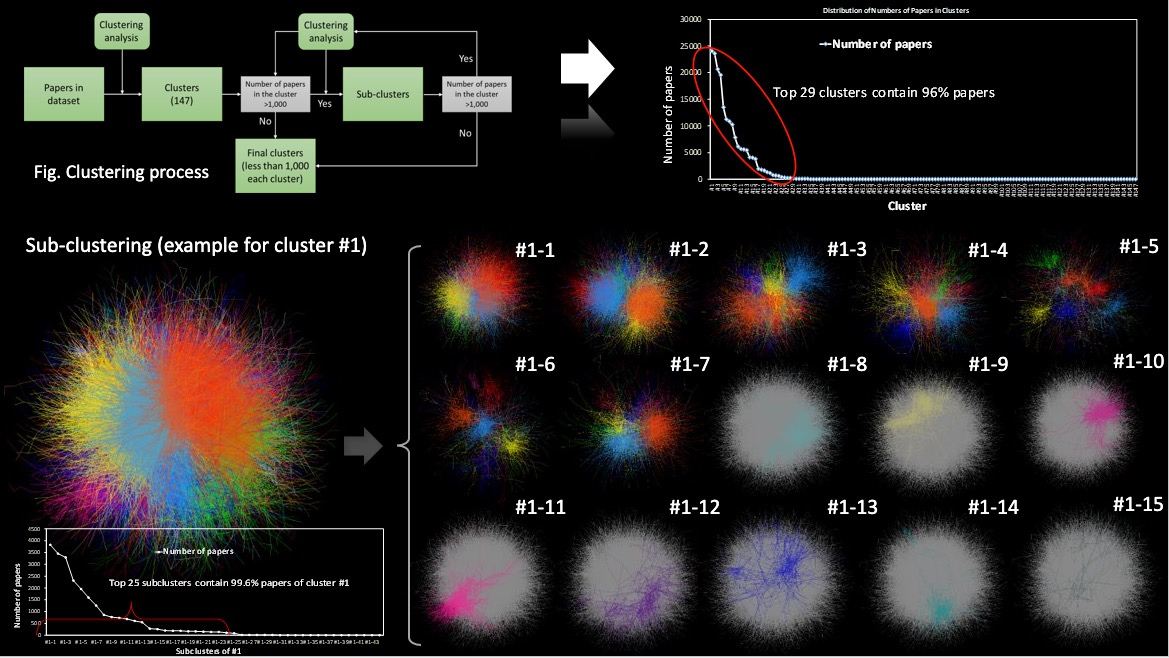
Key sectors and industries
Key sectors and industries having freshwater impact were identified by using the frequency of industries that occurred in the papers. Frequencies were obtained by text mining of abstracts, titles, and keyword lists of clustered papers in the citation networks.
Industry classification
In this project, we use the Global Industry Classification Standard (GICS) for identifying industries and sectors under assessment. The GICS framework is an industrial taxonomy used by the global financial community. The ultimate objective of this assessment is to use scientific evidence to communicate to investors, companies, and other stakeholders towards embracing systems thinking when dealing with water impacts and risk assessment.
Retrieving full list of industries
In total, 767 clusters and subclusters were generated in which the total numbers of papers were all less than 1,000. By definition, each cluster/subcluster has a different research focus. A text mining approach was used to retrieve all industries for all clusters and subclusters. We assumed that the more frequently an industry type appeared in clusters/subclusters, the more important that industry was to the topic of the cluster/subcluster. Therefore, the prioritization of industries for freshwater impacts was obtained by the number of occurrences of industries in all clusters and subclusters.
Exclusion of industries for further analysis
The full list of industries was created by merging those industries identified in reviews, grey literature, and the broad evidence dataset. Those sectors listed in GICS but that did not appear in our dataset were removed from our list of sectors. In particular, real estate and communication services sectors were excluded from this study.
Final industry selection
To obtain the final list of industries, we first extracted the full list of industries mentioned in all papers, and then we chose those industries that appeared in at least five papers. Using this list of industries, we performed a search in our metadata for the second round of assessment of relevance of the industries selected. We searched for papers in which the identified industries were mentioned in either the title, keywords, or abstract. This yielded potential lists of papers for all initially selected industries.
Next, we conducted an assessment of the relevance of papers using two key criteria: 1) industries and papers must have reported impacts on water and 2) papers must have geolocation information reported. For industries that have more than 200 papers, an extra criterion was added, i.e., the average number of citations of papers must be greater than four on a yearly basis. Based on the criteria, we identified the list of industries that fall in eight categories of sectors under GICS (Figure B31).
Figure B31. Key sectors and industries identified under GICS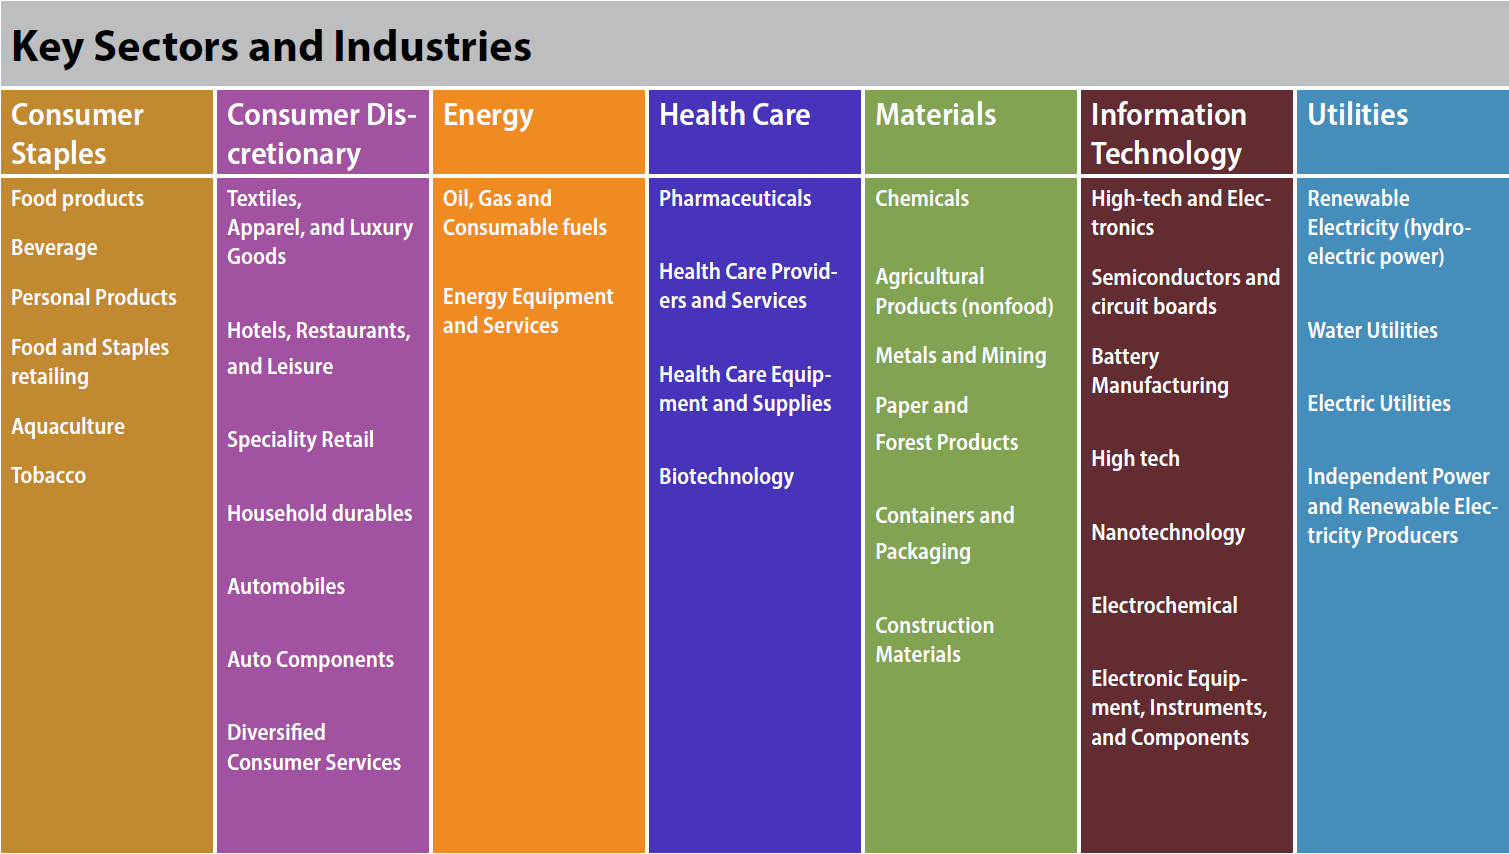
Data cleaning for identified industries
Creating metadata for identified industries
We removed all the irrelevant clusters and subclusters by screening the key terms extracted and perusing the titles and abstracts of top-cited papers within the cluster. We then merged all papers remaining in clusters/subclusters to create a metadata of industries for the assessment.
Identification of papers to be reviewed
To further identify papers under each industry, we used a combined bottom-up and topdown approach. For the bottom-up approach, we first identified papers through screening in the full metadata for titles, keywords, or abstracts that mentioned the industry. To ensure the representativeness of papers, we ranked all papers based on the average number of citations the papers had per year for large industries, such as the mining and oil and gas industries. For smaller industries that had fewer papers published in the literature (fewer than 200 papers), we manually excluded those that did not report water impacts.
For large industries, we then searched for groups of topics that were out of the study scope. Next, we performed a text-based assessment of papers (based on titles, abstracts, and full text) to include the most relevant and impactful papers in the bibliographic database. Citation network analysis captured the most impactful papers and provided a good way to process the dataset. We acknowledge that the data processing may screen out some important literature or that some recent literature might not be detected by the methodology followed here. The targeted searches at the review stage helped address the disadvantage. Also, any missing literature suggested by external reviewers was added during the report review processes.
In total, 664 papers and reports were identified for final review by the study team. Information was extracted from this literature and was organized into an informatics database using the DPSIR framework as the guide (see Appendix C). The complete list of the 664 papers and reports reviewed can be found here.
Appendix C - Methodology: Information Extraction—DPSIR
Summary
In this report, the Driver-Pressure-State-Impact- Response (DPSIR) model was applied as a conceptual framework to guide information extraction from research papers and reports. The model was then used to synthesize evidence that describes the causal chain of how various industrial practices and activities affect freshwater resources. Based on the causal chain, critical impacts and associated practices were identified according to the intensity and severity that have been reported in the literature.
DPSIR framework
The DPSIR framework was developed by the European Environment Agency as the extension of the previous OECD’s Pressure-State-Response model [12],[202]. It describes the chain of causal links starting with “drivers” through “pressures” to “states” and “impacts” on social and environmental systems, eventually leading to political “responses.” The framework has been widely used to evaluate how humans affect and interact with natural environments from local to global scales, such as land degradation and ecosystem changes, microplastic pollution in marine environments, and biodiversity impacts by socioeconomic drivers [203]-[205].
Figure C32. Key sectors and industries identified under GICS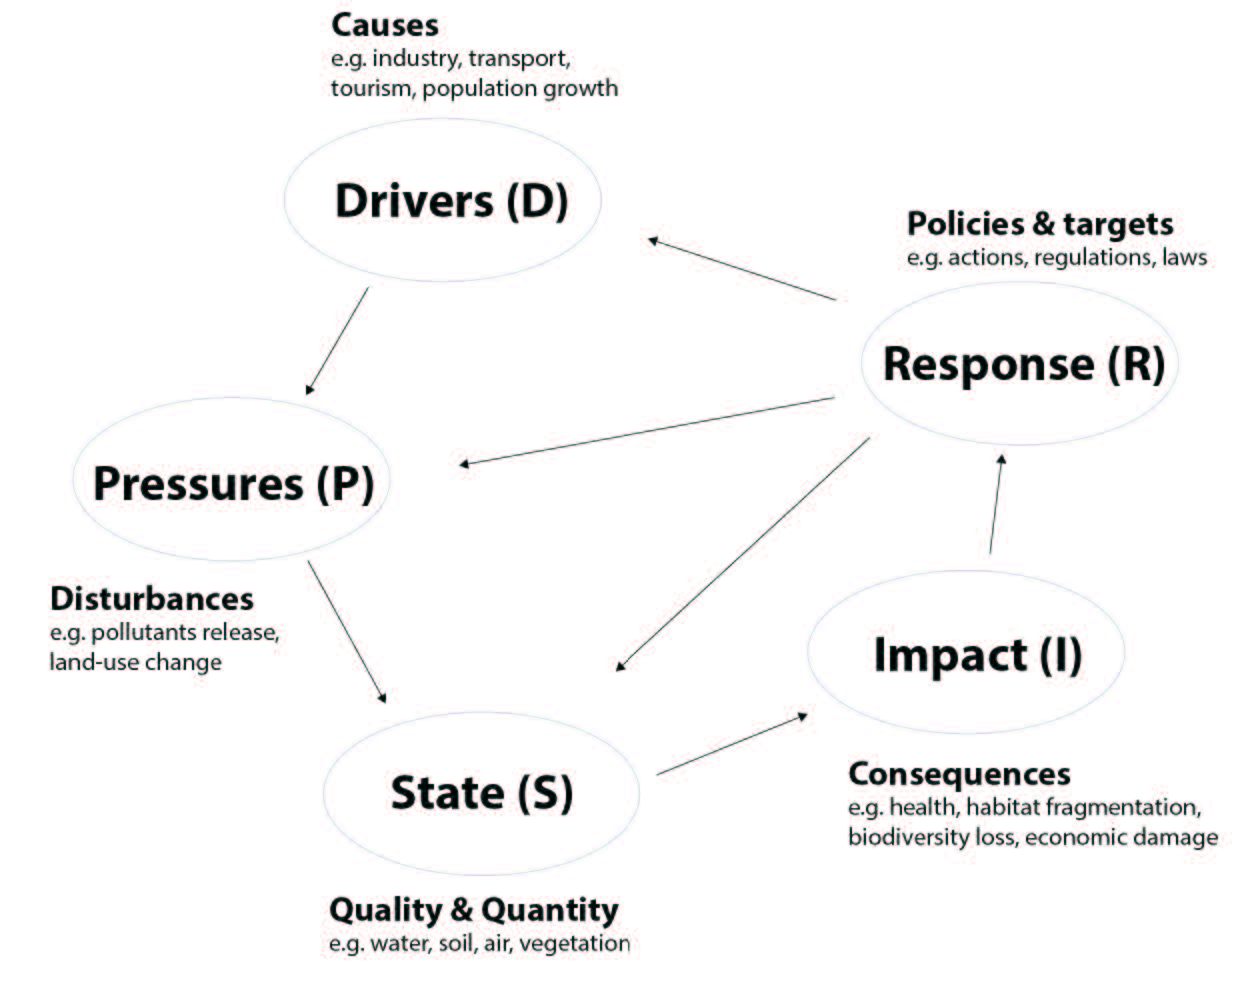
In the framework (Figure C32), Drivers (D) define those factors that motivate human activities, such as agricultural production and population growth, that are formed in the long run and beyond direct control or management. At the company level, a driver can be the need to generate profit through multiple practices that involve production of commodities. These practices lead to activities exerting Pressures (P) on the environment, such as pollutants release and land-use change. As a result of pressures, the State (S) of the environment is affected, which could change the physical, chemical, and biological conditions of the environments, such as the quality of air and water. Changes in the state of the environment can have a multi-faceted Impact (I) on the environment and society, determining the function of natural systems and the welfare of humans, such as biodiversity loss and hazards to human health. To adapt to and mitigate undesirable impacts, policy makers or individuals have to make Responses (R), such as setting targets and implementing regulations, which can affect any part of the causal chain between drivers and impacts [206]-[209].
DPSIR framework applied to the industry-water context
Figure C33. DPSIR framework applied to industry-water context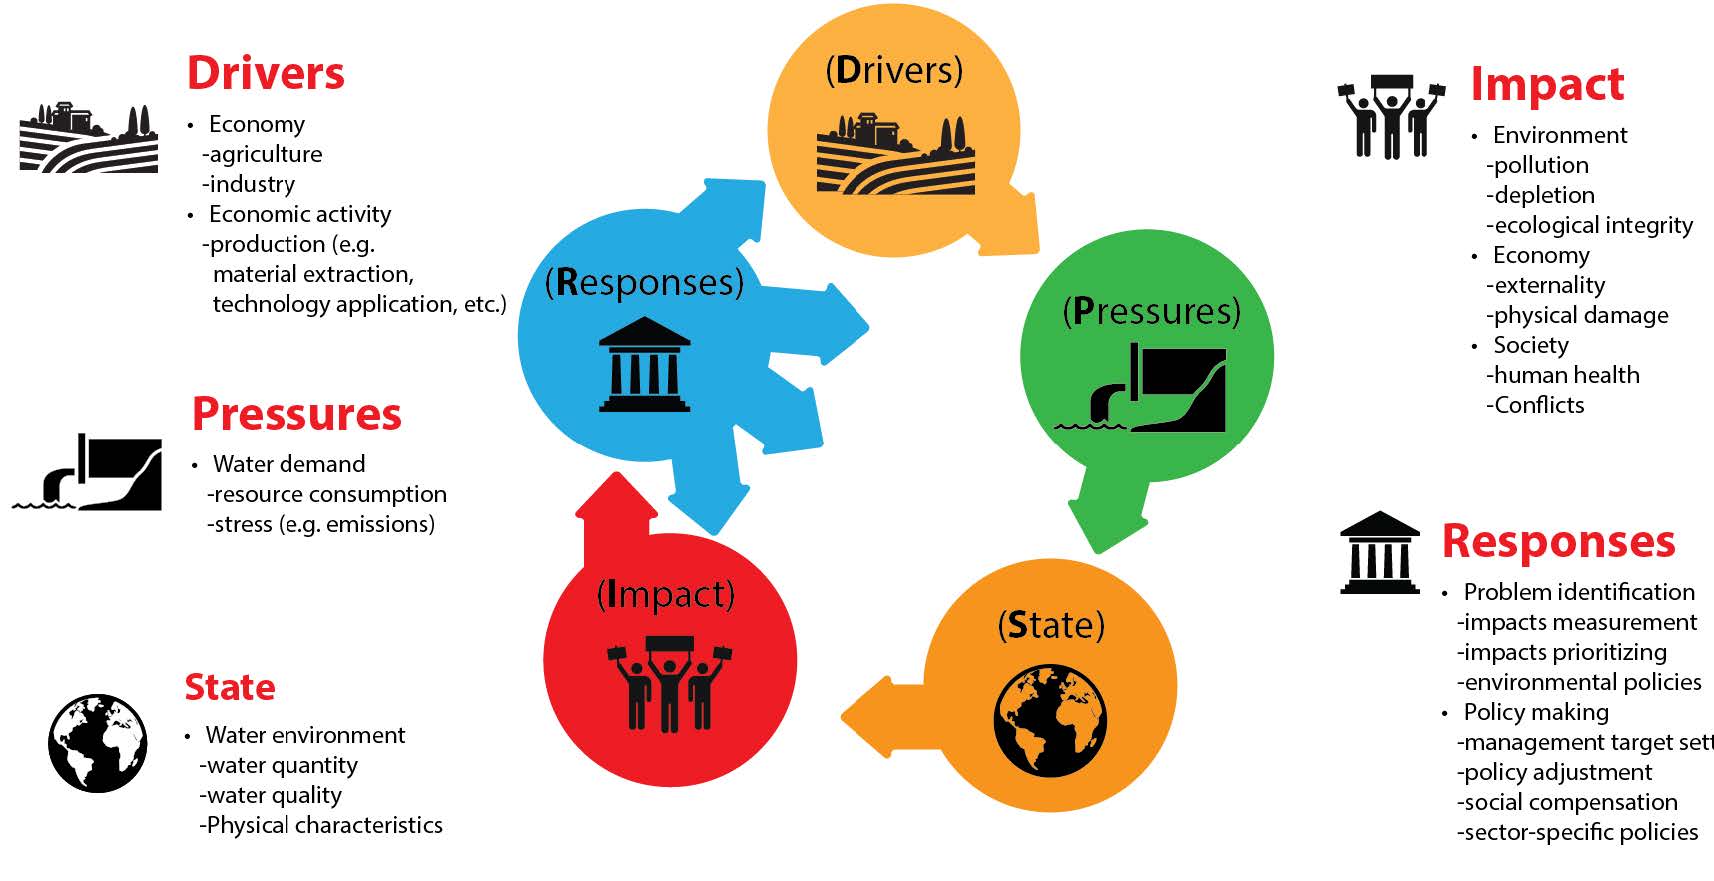
The state of water is determined by natural factors such as geological characteristics but also by pressures generated by industrial activities. The DPSIR framework was used in this project to capture a broad spectrum of how industries affect freshwater systems and societal response to these impacts (Figure C33). “D” refers to the demands industrial sectors are putting on freshwater for production, including product consumption levels and production patterns. “P” describes the stresses that such production demands place on freshwater systems through multiple practices and activities, which are divided into three types: excessive use of water resources, changes in water distribution, and emissions of pollutants to water bodies. “S” indicates possible alterations to water systems from industry in specific areas, including water consumed, chemical substance concentrations in wastewater and freshwater, and biological conditions in aquatic ecosystems. “I” describes the consequences of changes in conditions and functions of water and associated social-ecological systems, including impacts on biodiversity, freshwater depletion, conflicts, and human health. “R” includes adaptive actions taken by actors, such as individuals, communities, and government agencies, to prevent and mitigate negative impacts.
DPSIR framework for information extraction and organization
Using the defined framework, a comprehensive matrix was established to create the database for the information extraction and organization (the complete database is available upon request). In this matrix, drivers are GICS sectors and industry groups identified for the project. Pressures list all practices and activities from industries that are reported in the literature. State is organized into a hierarchical structure of conditions, starting with higher level and ending up with specific conditions, which are affected by industrial practices and activities. Specifically, the higher level of water condition is classified into water quality and water quantity, meaning that industrial practices and activities can generate pressures on water quantity or quality, or both. Under each classification, state variables are detailed at lower levels, followed by a measured quantity of variables that are reported in literature. For example, the swine farming practice can generate significant issues for water quality (high level) that involve chemical contaminants (lower level 1) and pharmaceuticals (lower level 2) and antibiotics (lower level 3). Impact in the matrix lists literature reports of consequences, which involve both direct impacts on water bodies, and indirect or consequent impacts on social, ecological, and economic systems, such as habitat fragmentation and water-related conflicts.
In this matrix, we also included information about the spatial and temporal scales of reviewed studies to specify if the reported impacts are chronic or emerging issues or shocks, and where they have occurred (applicable when they are identified in the literature). In addition, the value chain section specifies the source of the impacts along the industrial value chain. It should be noted that we extracted societal responses in a separate manner, given that this piece of information is not a common focus of most studies. Specifically, we first framed casual links between industrial practices and their pathways to impact water and associated systems, and then performed targeted searches for societal responses of each link in a broad way.
With the matrix, key information was extracted and helped clarify key messages and articulate them as science-based, but understandable narratives. For example, a review paper on the Food Products industry [210] can be summarized as: the practice of swine farming in the Food Products industry exerts great pressures on the quality of water bodies adjacent to swine farms due to the application of antibiotics for treatment and prevention of disease. Water pollution results from swine waste through runoff, which contains high concentrations of chemical contaminants dominated by antibiotics and hormones. The toxic pollution of swine farming is a worldwide issue, with significant contributions to the high concentration of pharmaceuticals in aquatic environments in many countries in Asia, America, Africa, and Europe. The global average concentration of tetracycline (an antibiotic) due to swine farming practices can reach 685.60 ug per liter of freshwater near farms. This high level of toxicants can threaten the health of aquatic ecosystems and humans. Although restrictions and regulations have been implemented since the 1980s in many countries, antibiotics are still in use to promote growth of food animals in several large livestock producing and exporting countries, such as China and Brazil.
Figure C34. Example of DPSIR framework applied to agricultural industry
The process of information extraction was conducted from sector to sector by the review team. The extracted information from literature reviewed within the same group was then synthesized to construct the casual chain between each industry and its water impacts. Figure C34 illustrates an example of how the packaged food and meat industry generates impacts on freshwater resources using the DPSIR framing and based on information extracted from literature. Based on the literature reviewed by the team, pressures by the packaged food and meat industry on freshwater are driven by practices during the production of vegetables, fruit, grain, meat, dairy products, and other foods. These production practices involve a number of water-related activities, including slaughtering and bleeding animals in factories, cooking and blanching processes, washing and sterilization, sanitization, and flushing, as well as cleaning. Intensive activities during production processes can alter the states of water in terms of its quality and quantity, which are reported in the literature to contribute to freshwater eutrophication and ecosystem and water quality degradation, and to cause depletion of water resources, water competition, and economic, as well as human health impacts.
Appendix D - Methodology: Industrial Impacts on Freshwater: Scoring Criteria
Table D5. Score criteria for industrial impacts on freshwater resources.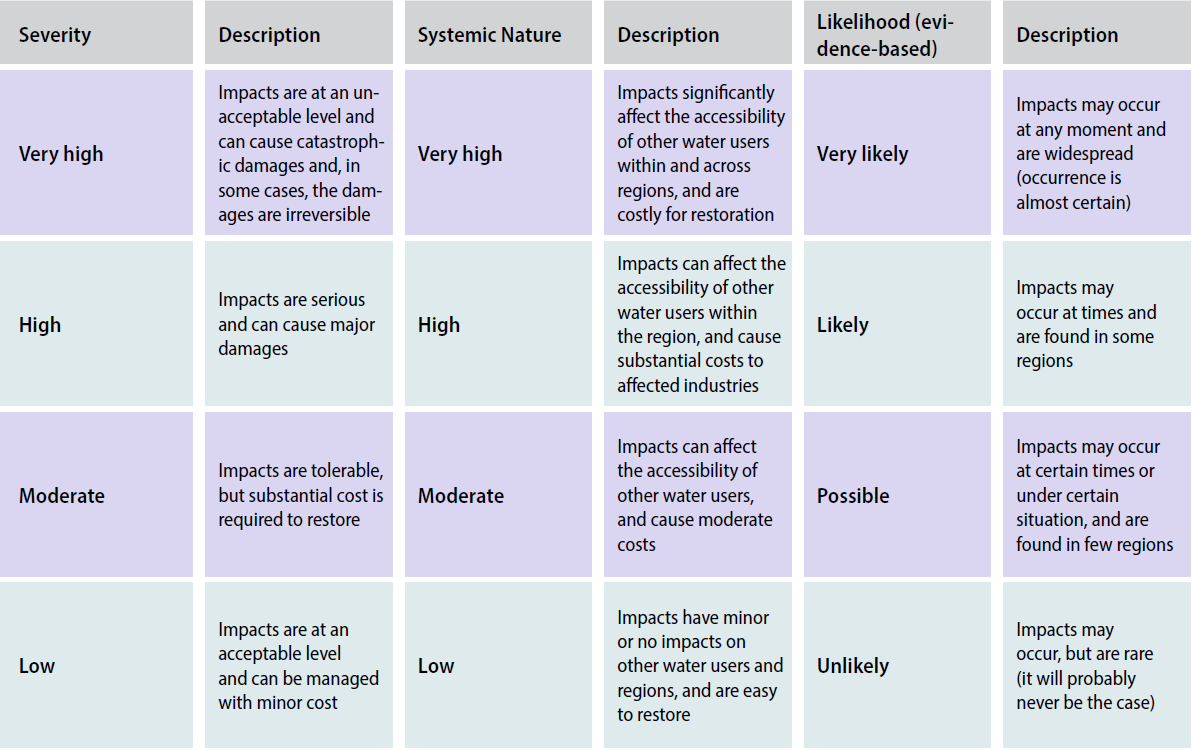
First, a set of narrative criteria for scoring impacts was established as described in Table D5, identifying four levels of severity, systemic nature, and likelihood. Metrics shown in tables D6, D7, and D8 illustrate how the scores for severity and the systemic nature of impacts should be given based on the narrative in Table D5. For each impact, severity and likelihood of impact were scored using Table D6, while the systemic nature and the likelihood of systemic impact were scored using Table D7. Further, a matrix was developed to aggregate severity and systemic nature scores into overall impact levels (table D8) based on the evidence identified in the literature. Based on literature review and extracted data, all identified impacts were classified into water quantity and quality dimensions, and their corresponding industries (Table D9). Table D9 also specified where these impacts are generated. A relative assessment was performed to produce the results presented in Table 1 and 2 in the main report.
The framing of impacts in this way allows for overall scoring and weighting of the relative impacts of these different industrial sectors, which can be helpful for investors and companies in prioritization.
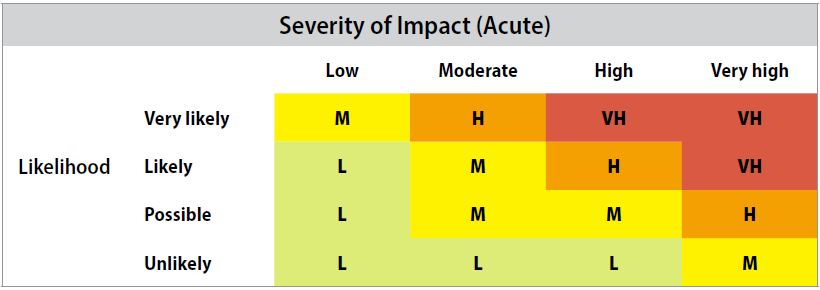

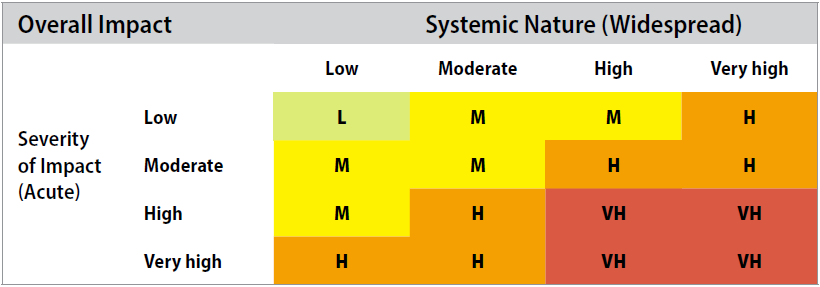
Table D9. A high-level summary showing water quantity and quality impacts along the value chain. Identifies the industries contributing to high and very high impacts to water resources found within the literature and specifies the impact and the location within the value chain where the impacts take place. Industries identified as having low impacts on freshwater resources are not included in the table (Hotels, Restaurants, and Leisure, Consumable Fuels, Electroplating, and Construction Materials).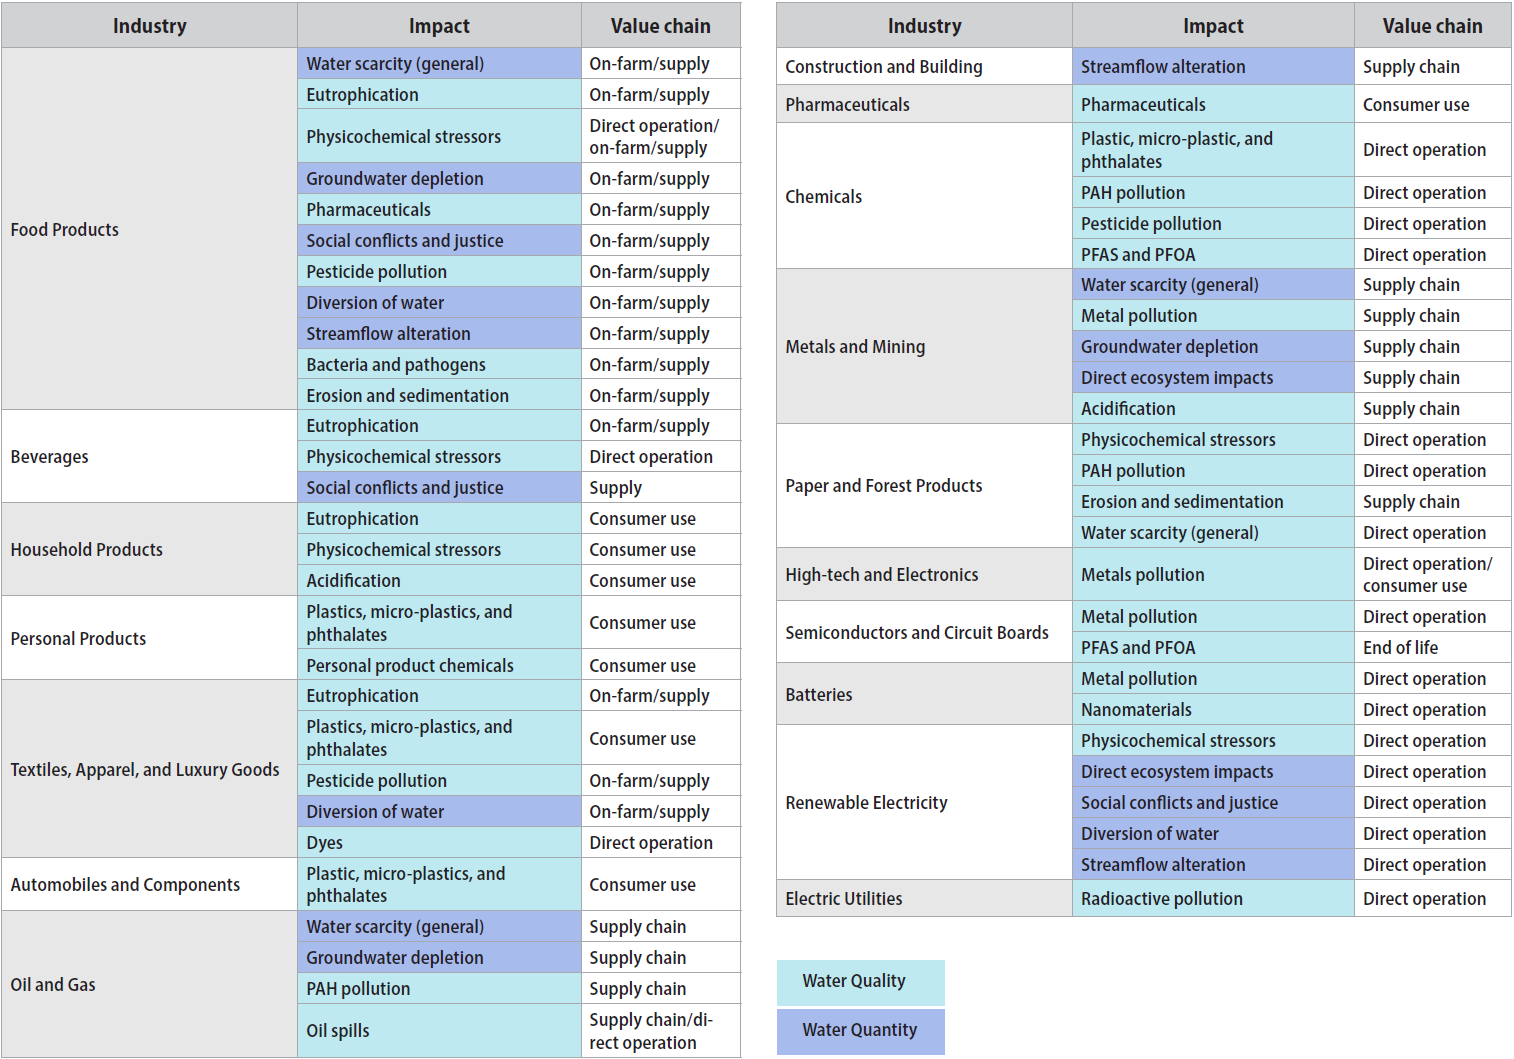
Appendix E - Industry Sectors: Value Chain Analysis of Practices, Externalities and Water Impacts Globally (continued)
Apart from the twelve industries identified as having severe impacts on water resources and emerging impacts on water throughout the value chain., outlined in Chapter 2, the following section describes the other industries identified in the literature review as having impacts on freshwater.
1. Consumable Staples Sector
Household Products
The Household Products industry includes products such as soaps, detergents, and diapers. Household products are a large source of phosphates in surface water, though the use of phosphates in laundry detergent has been banned by some governments since the 1970s. While the manufacturing processes for household products have significant impacts on freshwater, the industry’s biggest impact stems from consumer use. For example, wastewater discharges of detergents can cause ecotoxicity, acidification, and eutrophication. Discharges are also a major source of plastics and microplastics in water bodies. Given growing consumer demand, the impacts are likely to worsen.
Figure E35. Summary of Household Products industry freshwater impacts along its value chain, including consumer use and manufacturing. Selected hotpots are the regions frequently cited in the literature.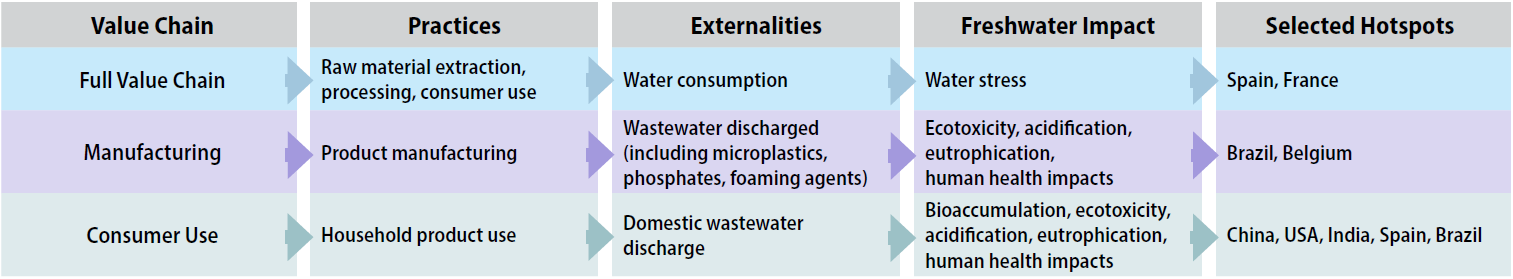
Personal Products
Personal Products include cosmetics, fragrances, lotions, and sunscreens. The Personal Products industry is generating emerging contaminants, such as pharmaceuticals, surfactants, and exfoliants. The industry has impacts on freshwater mainly through consumer end uses. Among the biggest impacts associated with the use and disposal of these products are high concentrations of chemical compounds released into water bodies through municipal wastewater systems.
Figure E36. Summary of Personal Products industry freshwater impacts along its value chain. Selected hotpots are the regions frequently cited in the literature.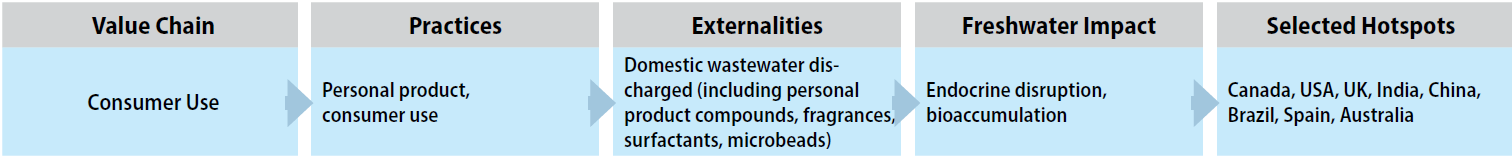
2. Consumer Discretionary Sector
Automobiles and Components
The Automobiles and Components industry includes companies that produce cars, trucks, and other vehicles, and manufacturers of parts and accessories for automobiles. Water is essential for vehicle manufacturing. It is also used for producing raw materials for parts and components, such as rubber for tires. The manufacturing process produces pollutants which are discharged to water bodies.
Figure E37. Summary of Automobiles and Components industry freshwater impacts along its value chain, including on-farm production and manufacturing. Selected hotpots are the regions frequently cited in the literature.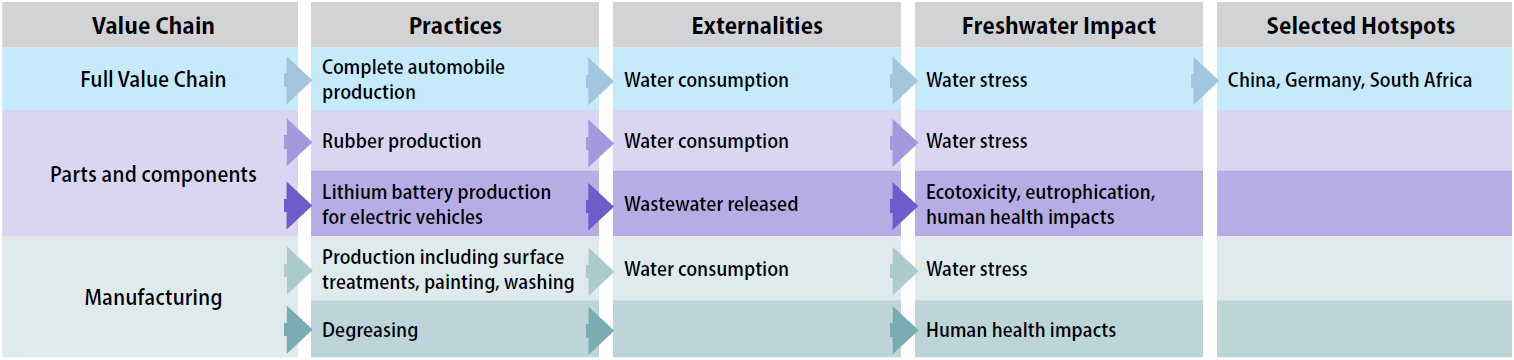
Hotels, Restaurants, and Leisure
The Hotels, Restaurants, and Leisure industry includes a variety of sub-industries with close connections to tourism and leisure activities, including hotels, resorts, cruises, leisure facilities, and restaurants. General tourism and maintenance of golf courses are the most water intensive practices of this industry. The industry releases pollutants into water bodies, including pesticides and nutrients. Pesticides and nutrient runoff mainly stem from landscaping and maintenance practices, such as growing turf on golf courses and horticultural activities. Wastewater from restaurants and hotels is another key contributor of nutrients to water bodies.
Figure E38. Summary of Hotels, Restaurants, and Leisure industry freshwater impacts freshwater along its value chain. Selected hotpots are the regions frequently cited in the literature.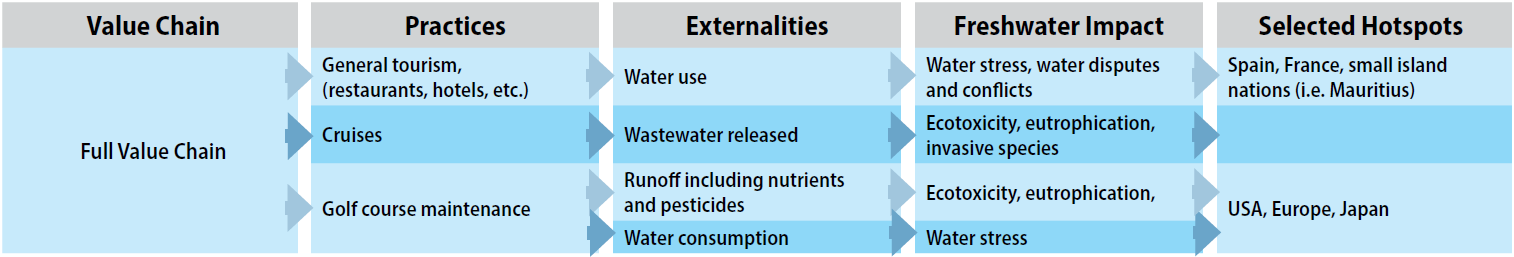
3. Energy Sector
Consumable Fuels
The Consumable Fuels industry includes companies that are involved in the production of consumable (biofuel) fuels used to generate energy. The value chain of the Consumable Fuels industry involves collecting fuel or gas sources, energy generation, transmission, and distribution. Within the consumable fuels industry, water withdrawals and consumption for the irrigation and production of crops used for biofuels, such as corn and wood for ethanol and soybeans for biodiesel, have the largest freshwater impacts.
Figure E39. Summary of Consumable Fuels industry freshwater impacts along its value chain from raw material sourcing to energy production. Selected hotpots are the regions frequently cited in the literature.
4. Industrials sector
The Industrials sector encompasses industries including Building and Construction and Electroplating. These identified industries pose a great threat to water quality due to the large number of heavy metals (e.g. copper and chromium) they use. They also pose a threat to water quantity predominantly due to the consumption of water resources. (It should be noted that definitions of industries used in literature are sometimes different from those in GICS. Some industries may not perfectly correspond to GICS definitions. As building and construction industries under GICS and their impacts identified in literature involve multiple sectors, this report classifies the Construction and Building industries as a group within the Industrials sector.)
Construction and Building
The value chain of the Construction and Building industry includes the entire life cycle of buildings (both residential and non-residential), from the raw materials used in their construction to their maintenance and deconstruction. Water impacts are found along the value chain, including impacts related to the extraction and processing of certain building products, such as the production of wood building products. The built environment itself also contributes to significant water pollution through storm and urban runoff.
Figure E40. Summary of the Construction and Building industry freshwater impacts along its value chain from raw material sourcing to deconstruction. Selected hotpots are the regions frequently cited in the literature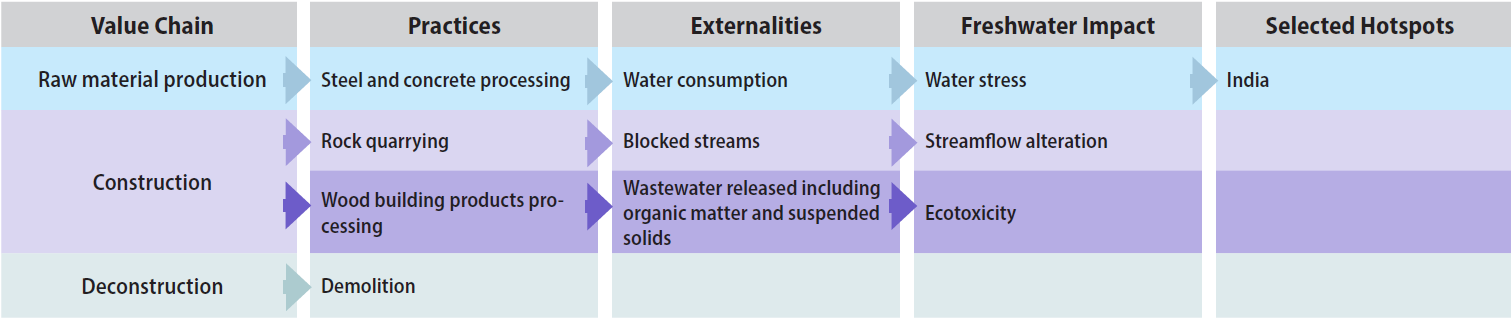
Electroplating
In the Electroplating industry, metal objects are coated with a thin layer of different metals, involving three stages: pre-treatment, electroplating, and post-treatment. Electroplating is used in many transportation industries, such as automotive, aerospace, and marine, as well as in the production of electrical parts and components. This industry poses great concern for water resources due to the potential for heavy metal pollution if wastewater is improperly treated.
Figure E41. Summary of the Electroplating industry freshwater impacts through its processing in factories. Selected hotpots are the regions frequently cited in the literature.
5. Materials Sector
Construction Materials
The Construction Materials industry includes manufacturers that produce materials for construction and buildings. This industry provides the construction and building industries with raw materials, such as brick, cement, concrete, glass, pavement, and stone. The industry’s impacts on water stem primarily from the extraction and processing of raw materials, with concrete production having the most significant impacts globally. Cement production is hazardous to water quality, with discharges including high concentrations of lead, zinc, copper, nickel, iron, manganese, and aluminum.
Figure E42. Summary of the Construction Materials industry impacts through production of concrete and cements for the construction and building industry. Selected hotpots are the regions frequently cited in the literature.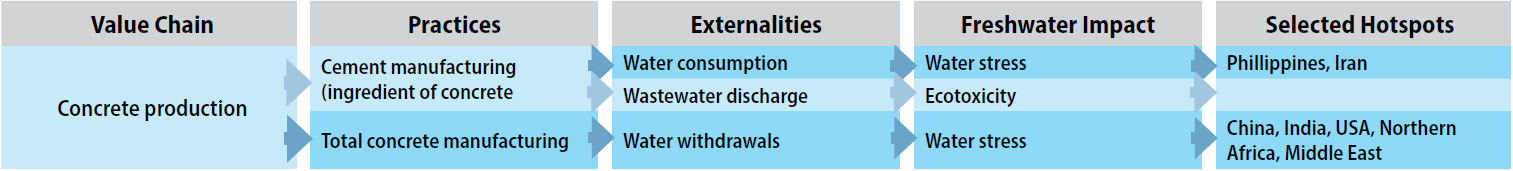
6. Utilities Sector
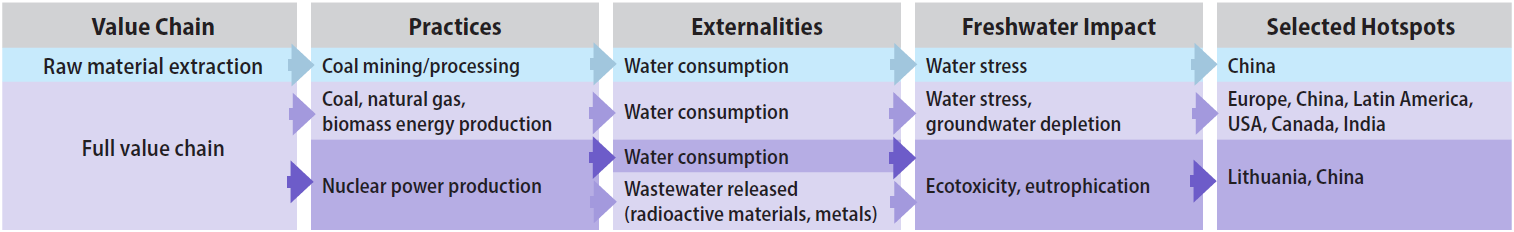
Electric Utilities
The Electric Utilities industry encompasses companies and industries that produce electricity through coal-fired power production, natural gas, and nuclear power. The Electric Utilities industry consumes significant amounts of water, especially during cooling processes. Coal-fired power plants require water throughout the value chain, including for mining, cooling, and washing processes. Electric power facilities can release contaminants, such as heavy metals, radioactive material, heat waste, and heavy metals, such as cesium and lead, or radioactive compounds, such as argon, krypton, and xenon.
Figure E43. Summary of Electric Utilities freshwater impacts along its full value chain. Selected hotpots are the regions frequently cited in the literature. Selected hotpots are the regions frequently cited in the literature.